The leftward-marching Labour Party and the unmoving British electorate

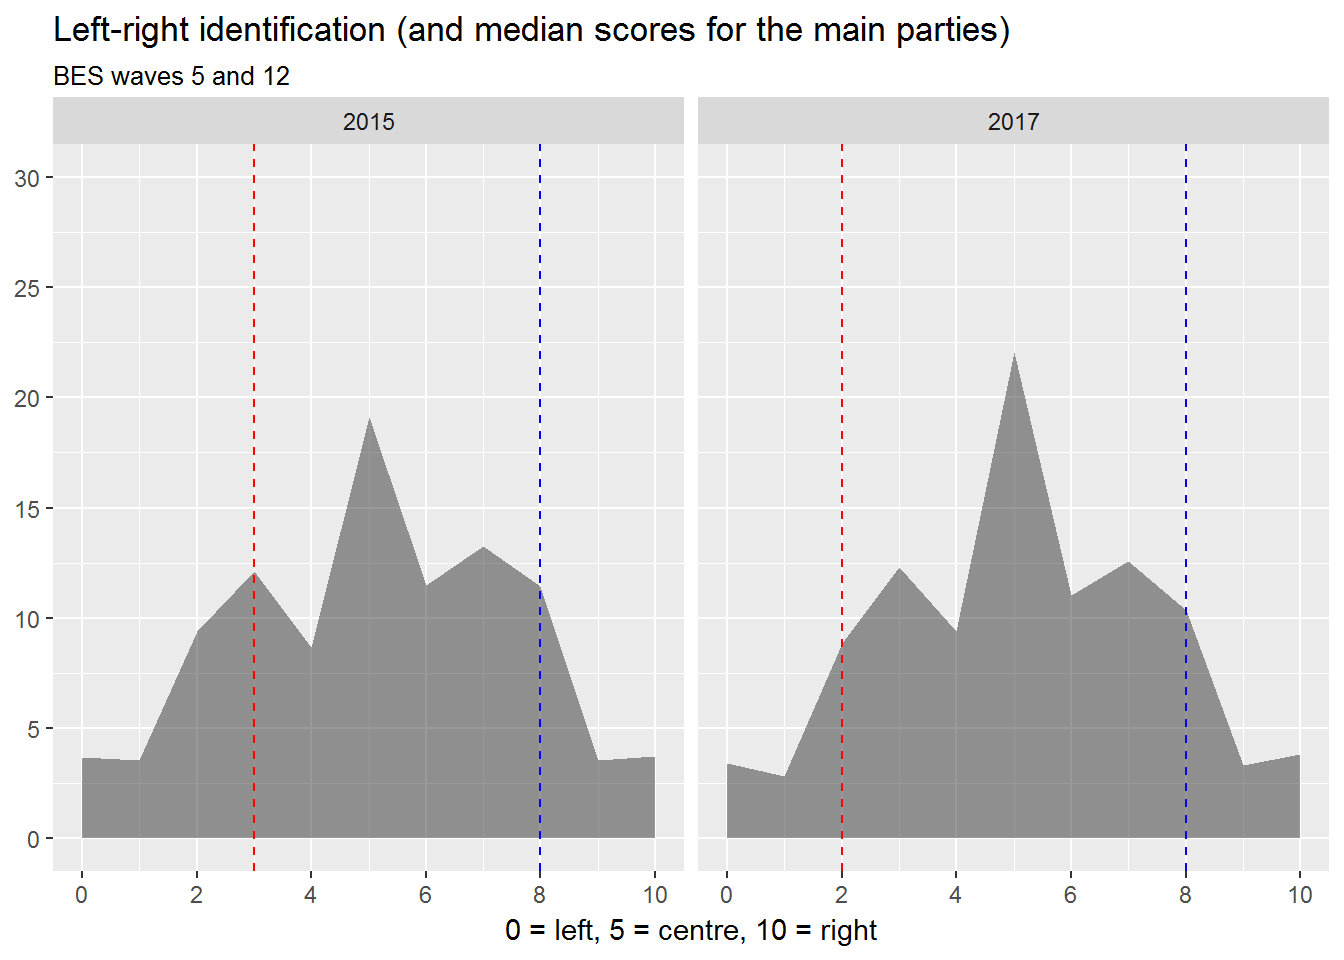
Last year, I did some analysis of how respondents to surveys carried out as part of the British Election Study placed themselves and the main British political parties on a left-right scale. This suggested that, despite what the election results might lead one to expect, there appeared to be no leftward shift amongst voters between the 2015 and 2017 general elections, although there was a strong leftward shift in their perceptions of the Labour Party. One thing I couldn’t explore using the type of analysis and visualisation I carried out there is whether the same people were identifying themselves and the two main parties with the Left, the Right, and the Centre, or whether it was different people but in similar numbers. Because the BES is a longitudinal study, repeatedly surveying the same individuals (so far as is possible), we can reasonably ask this question. But how can we answer it? One way is by using alluvial diagrams, a form of visualisation developed in order to visualise change over time. (If you want to know how to make your own, there’s a guide to creating alluvial diagrams with R in the longer version of this article.)

Self-ratings on the left-right political scale in BES waves 5 and 12

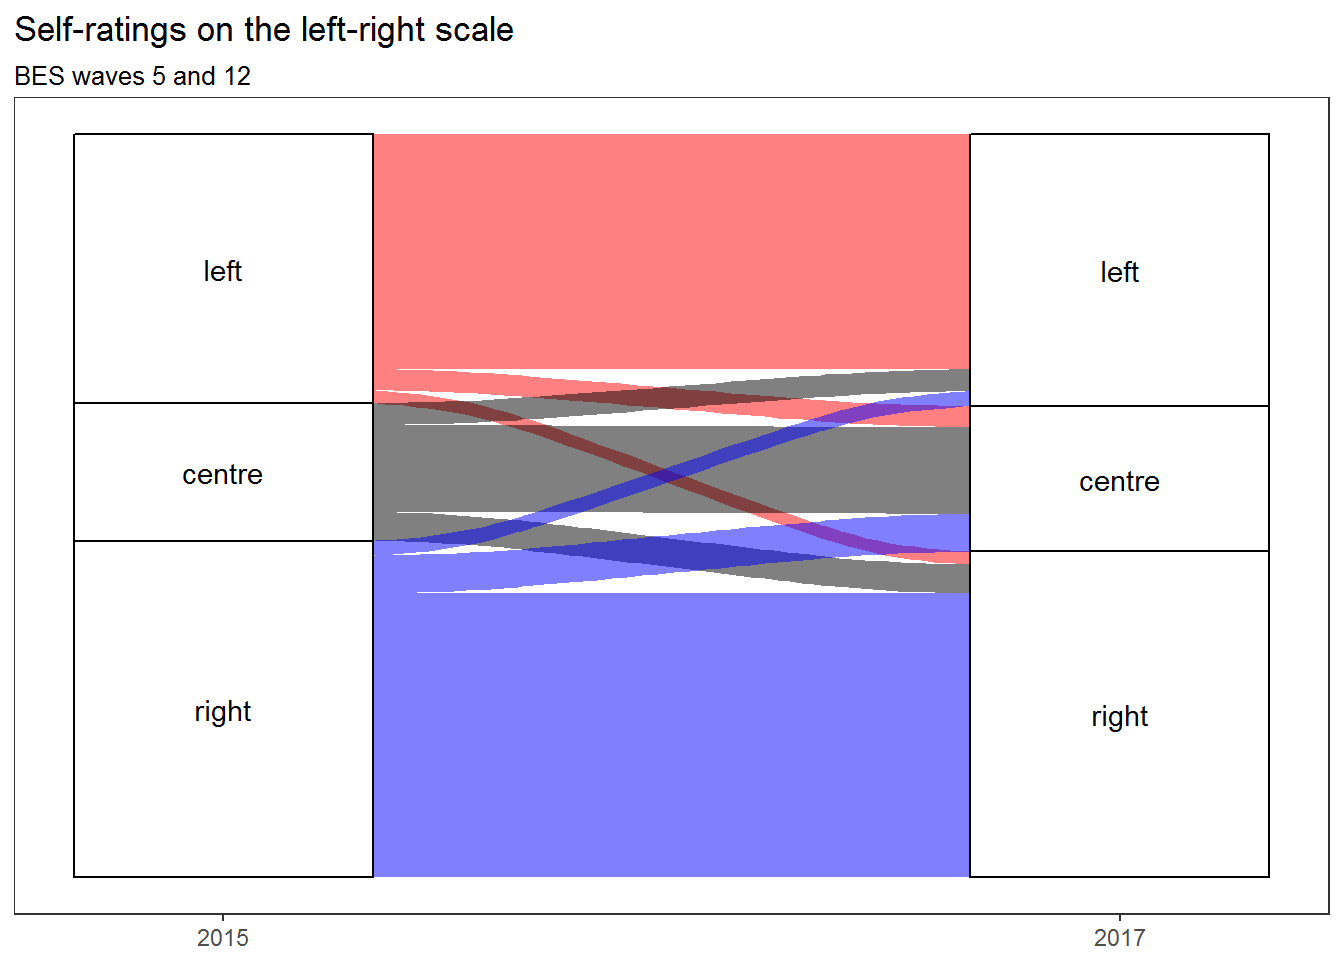
This alluvial diagram shows that people tended to give the same answers in 2015 and 2017, and that any movement tended to be balanced by approximately equal movement in the other direction, except in that there was more movement from the Right to the Centre than from the Centre to the Right (despite which, the Right remained larger than the Left overall). This supports the view that there was no leftwards shift on the part of the electorate between 2015 and 2017. But what about the major parties?

Continue reading “The leftward-marching Labour Party and the unmoving British electorate”

Importing National Student Survey data with R (or: how doing things programmatically helps to avoid mistakes)

I recently started to do some work with NSS (National Student Survey) data, which are available from the HEFCE website in the form of Excel workbooks. To get the data I wanted, I started copying and pasting, but I quickly realised how hard it was going to be to be sure that I hadn’t made any mistakes. (Full disclosure: it turns out that actually I did make some mistakes, e.g. once I left out an entire row because I hadn’t noticed that it wasn’t selected.) Using a programming language such as R to create a script to import data requires much more of an investment of time upfront than diving straight in and beginning to copy and paste but the payoff is that once your script works, you can use it over and over again – which is why I now have several years’ worth of NSS data covering all courses and institutions, from which I can quite easily pull out whichever numbers I want using a dplyr filter statement (as long as I am prepared to take account of irregularities e.g. in institutions’ names from one year to the next – which would also be necessary when doing things by point-and-click).

For example, looking at how all institutions performed in my particular discipline with regard to the four NSS questions relating to teaching quality, I can see that Media Studies at the University of the West of England managed the quite remarkable feat of rising from 68th place in 2015 to 2nd place in 2016 before falling back to 53rd place in 2017. To visualise only these four questions in relation to this subject at this institution over the whole time period for which I have data, I can filter out everything relating to other disciplines and other institutions with a single statement, and then use ggplot to represent each of the four variables that I’m interested in with a different coloured line:

Student perceptions of teaching quality in Media Studies at UWE Bristol

How could such a dramatic rise and fall occur? Maybe someone who still works at UWE would be better placed to explain. But the general question of what drives student perceptions of teaching quality is one that I’m interested to explore as a researcher – and I’ll be posting thoughts and findings here as and when.

In the meantime, here’s my code, presented as an example of how the automation of error-prone tasks can take some of the uncertainty out of the research process. You probably aren’t interested in working with this particular dataset, but you may have other datasets that you would like to deal with in the same way. Yes, it looks complicated if you’re not used to scripting – but the code is actually quite simple, and the thing is that I was able to build it up iteratively, by adding statements, running the script as a whole, noticing what went wrong, and then fixing whatever it was, one step at a time. (The code is very heavily commented, to give a non-coder an idea of what those steps were and what sort of thinking is typically involved in taking a code-based rather than point-and-click-based approach to data importing etc.)

Continue reading “Importing National Student Survey data with R (or: how doing things programmatically helps to avoid mistakes)”

The unnoticed rise of the centrist voter (and what it means for Labour)

Centrist dads, eh? (And presumably also centrist mums, although abusing them on behalf of the Absolute Boy might sound less like striking a feminist blow against patriarchy.) How wrong they were! They were so sure that Labour was going to lose the election, when as everyone now knows… well, actually, Labour did lose, but never mind — the centrists were still wrong. Slugs! By refusing to compromise on his left wing principles, Jeremy Corbyn shifted the Overton Window, opened up some clear red water between Labour and the Tories, and flipped social liberals for Socialism. In losing the election by a mere 55 seats out of a possible 650, he achieved total vindication for his strategy, and proved that he only has to do more of the same in order to find himself at the head of the Government after the next election (unlike — say — Gordon Brown, who lost by 48 seats and resigned, the melt). Onward, comrades! Onward to Socialism!

Now, I don’t believe that many people primarily choose whether or not to vote for a party to vote on the basis of how ‘left’ or ‘right’ they believe it to be. But ideas of leftness and rightness provide people with a way of summarising their relationships with political parties, and for this reason, I think it’s worth paying attention to the answers they give to survey questions about where they place themselves and the major parties on the left-right spectrum. And so we come to waves 5 and 12 of the British Election Study (or BES), in which a staggering 30725 and 34464 respondents took part immediately prior to the UK General Elections of 2015 and 2017. In the following chart, based on BES data, the grey areas show how people identified themselves, while the red and blue lines show how they typically situated the Labour Party and the Conservative Party on the same axis (respectively).1

l-r-ident-plus-median-parties

Continue reading “The unnoticed rise of the centrist voter (and what it means for Labour)”

Antisemitism and the misuse of statistics

Last week saw the publication of a very strange report entitled ‘How serious is the threat of antisemitism in Britain today?’ and published on the website of the controversial Jewish Voice for Labour group. It was written by Alan Maddison, an ‘independent strategist’ and associate member of the group with a history of previous attempts to discredit claims of antisemitism. Maddison begins by noting some recent media headlines about antisemitism, and then proceeds to set out the following position:

A review of the latest evidence, presented here, suggests that these headlines are unnecessarily alarmist. The pro rata risks for assaults are lower for Jewish people than for those from other races or religions. The increase in antisemitic hate crimes reported to the police is around half that reported for other victim groups. Finally, a Jewish person is 50 times more likely to be the victim of a general assault than one motivated by antisemitism

Having set out this position, Maddison promises to ‘review the latest evidence behind these more reassuring statements, and place antisemitic hate crime in a broader perspective’. Unfortunately, the way in which he does so discredits the entire enterprise, and calls into question Jewish Voice for Labour’s motivations in publishing his report.

I’ll go through Maddison’s arguments one by one.

Continue reading “Antisemitism and the misuse of statistics”

The left, the right, the centre – and what they care about most

Why did people vote as they did in the June 2017 UK general election, and how might they vote in the next one — whenever it comes? One of the best sources of information on that question is wave 13 of the British Election Study: a very large survey conducted just after the election for a consortium of academics at the University of Manchester, the University of Oxford, and the University of Nottingham. Altogether 31196 respondents completed the survey, of whom 27019 (after weighting) answered the question ‘As far as you’re concerned, what is the SINGLE MOST important issue facing the country at the present time?’ and 23194 (again after weighting) identified themselves politically by positioning themselves on an eleven point scale from left to right. 21213 both placed themselves on the scale and gave their view on the most important issue. I’ve been working with this dataset for a little while, looking at how demographic variables predict perceptions of the most important issue (see my earlier post for my initial exploration of this topic), but here I’d like to focus on the association of particular issues with particular positions on the political spectrum:

mii-by-left-right-w13

Continue reading “The left, the right, the centre – and what they care about most”

Mapping the political Twittersphere

Public seminar by Daniel Allington
Starts: 16:00 15 Nov 2017
At: Mitchell Centre for Social Network Analysis, University of Manchester

Who follows British politicians on social media? Who stood with Ken Livingstone online? What would it be like to get all your political news from Twitter?

For over a year, I’ve been seeking answers to these questions and more using data scraping and a mixed methods approach centred on social network analysis. Social media have changed British political culture, creating quasi-celebrities out of figures who would otherwise have been condemned to the margins, and giving wide circulation to ideas long believed to be politically defunct – most alarmingly, the belief in an international conspiracy of Jews. In this seminar, I will present theoretical and methodological approaches to the large-scale study of online political culture, as well as sharing preliminary findings.

Open to all. Booking via the University of Manchester events website.

Misogyny is intrinsic to a Far Left built on bullying

The journalist, Sam Kriss — a member of the Labour Party — has been accused of sexual harassment. So has the journalist, Rupert Myers — a member of the Conservative Party. And so, on the other side of the Atlantic, have the movie mogul, Harvey Weinstein — a supporter of the Democrats — and the TV host, Bill O’Reilly — a supporter of the Republicans. There is nothing specifically left or right wing about misogyny.

But there is something very specific indeed about the misogyny of the contemporary British Far Left: something very specific that is very specifically denied when Corbyn’s cheerleaders enthuse that ‘Corbynite slang is remarkably unproblematic in its derivation’, or insinuate — however ridiculously — that ‘centrists’ are particularly prone to transphobia, or suggest, with unintentional irony, that the real threat faced by left wing women is that of ‘centrist dads’ who ‘want to educate you and hate fuck you’. (Honestly, there’s nothing new about the sexual abuse of women on the far left by men more highly placed in the far left’s brutal hierarchy.)

Continue reading “Misogyny is intrinsic to a Far Left built on bullying”

Sam Kriss and the misogyny of the Far Left

Today, an accusation of sexual harassment was made against Sam Kriss, freelance Vice and Guardian journalist and alt-left attack dog. You should read the whole thing, as well as the public statement in which he acknowledges the truth of the allegations but tries to paint his behaviour as arising from a simple misunderstanding between friends.

Kriss admits having ‘crossed a line from persistence to aggression’ in consequence of ‘not picking up on [his accuser’s] signals’ — where he considers that ‘line’ to lie, and how much more obvious her ‘signals’ would have had to have been for him to take notice of them, he does not explain — but insists: ‘Anyone who follows me closely will be aware that I am friends with many women with public platforms.’ Perhaps he is, but he’s been a public enemy to many others. His accuser highlights this:

I had hoped I would never have to write this account. But watching a man who repeatedly groped me, twisted my neck to forcibly kiss me, ignored any attempt I made to stop him, and refused to ‘let me’ drink non-alcohol, unashamedly attack feminists online, use misogynist language, singling out women for ridicule time and time again, means I’ve not really been able to forget.

Sam Kriss is one of several young men on the Far Left who have been extensively rewarded for public displays of aggression and misogyny. His abusiveness was not merely enabled by but key to his success within the political culture in which he made his career — which is, at the end of the day, only the latest version of the political culture that enabled generations of sexual abusers such as Gerry Healy and Comrade Delta. His accuser did a brave thing in speaking out.

‘The usual suspects’: Euler diagrams of letter signatories as a practical application for set theory

The day before the 2017 Labour Party Conference in Brighton, Labour Vision published an essay in which I argued that responsible non-Jews on the Left should take note of majority Jewish opinion, and not ignore it in favour of tiny minority groups on the fringes of the Jewish community whose opinion happens to be more convenient for Leftists. What actually happened at the conference is history — and quite unpleasant history at that (for details, I recommend reading both Marcus Dysch’s overview of events and David Collier’s eyewitness account). There’s much more to be said on the topic, and I’ll get around to saying some of it before long, but for now, I’d like to revisit the odd little centrepiece of my Labour Vision essay: the analysis of signatories to four letters opposing action against antisemitism. (tl;dr: There are very few Jews who are committed anti-Zionists, but the anti-Zionist movement needs them in order to maintain the impression of not being anti-Jewish, so a lot of the same names get recycled between different open letters to the press. Also, a tutorial on how to make Euler diagrams in R. Something for everyone?)

euler_diagram

Continue reading “‘The usual suspects’: Euler diagrams of letter signatories as a practical application for set theory”

Imaginary (Jewish) friends

It is an article of faith for many on the British Left that measures to combat left wing antisemitism are in reality measures to combat Labour Party leader Jeremy Corbyn: attempts promoted by the fiendish ‘Israel Lobby’, and opposed by Jews. Yes, by Jews. You know the Jews I mean: maybe not the Jews you’ve actually met, but, as Chaminda Jayanetti put it, ‘the Good Jew[s] – the Perfect Jew[s]. The Manic Pixie Dream Jew[s]. The Jew[s] to be put on a placard as evidence of how Not All Jews support Israel.’ There’s a certain kind of Leftist who needs those Jews.

Continue reading “Imaginary (Jewish) friends”