The unnoticed rise of the centrist voter (and what it means for Labour)

Centrist dads, eh? (And presumably also centrist mums, although abusing them on behalf of the Absolute Boy might sound less like striking a feminist blow against patriarchy.) How wrong they were! They were so sure that Labour was going to lose the election, when as everyone now knows… well, actually, Labour did lose, but never mind — the centrists were still wrong. Slugs! By refusing to compromise on his left wing principles, Jeremy Corbyn shifted the Overton Window, opened up some clear red water between Labour and the Tories, and flipped social liberals for Socialism. In losing the election by a mere 55 seats out of a possible 650, he achieved total vindication for his strategy, and proved that he only has to do more of the same in order to find himself at the head of the Government after the next election (unlike — say — Gordon Brown, who lost by 48 seats and resigned, the melt). Onward, comrades! Onward to Socialism!

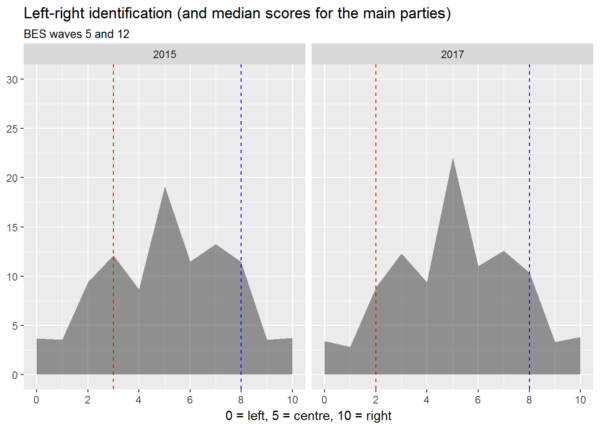
Now, I don’t believe that many people primarily choose whether or not to vote for a party to vote on the basis of how ‘left’ or ‘right’ they believe it to be. But ideas of leftness and rightness provide people with a way of summarising their relationships with political parties, and for this reason, I think it’s worth paying attention to the answers they give to survey questions about where they place themselves and the major parties on the left-right spectrum. And so we come to waves 5 and 12 of the British Election Study (or BES), in which a staggering 30725 and 34464 respondents took part immediately prior to the UK General Elections of 2015 and 2017. In the following chart, based on BES data, the grey areas show how people identified themselves, while the red and blue lines show how they typically situated the Labour Party and the Conservative Party on the same axis (respectively).1

l-r-ident-plus-median-parties

Continue reading “The unnoticed rise of the centrist voter (and what it means for Labour)”
Antisemitism and the misuse of statistics

Last week saw the publication of a very strange report entitled ‘How serious is the threat of antisemitism in Britain today?’ and published on the website of the controversial Jewish Voice for Labour group. It was written by Alan Maddison, an ‘independent strategist’ and associate member of the group with a history of previous attempts to discredit claims of antisemitism. Maddison begins by noting some recent media headlines about antisemitism, and then proceeds to set out the following position:

A review of the latest evidence, presented here, suggests that these headlines are unnecessarily alarmist. The pro rata risks for assaults are lower for Jewish people than for those from other races or religions. The increase in antisemitic hate crimes reported to the police is around half that reported for other victim groups. Finally, a Jewish person is 50 times more likely to be the victim of a general assault than one motivated by antisemitism

Having set out this position, Maddison promises to ‘review the latest evidence behind these more reassuring statements, and place antisemitic hate crime in a broader perspective’. Unfortunately, the way in which he does so discredits the entire enterprise, and calls into question Jewish Voice for Labour’s motivations in publishing his report.

I’ll go through Maddison’s arguments one by one.

Continue reading “Antisemitism and the misuse of statistics”

The left, the right, the centre – and what they care about most

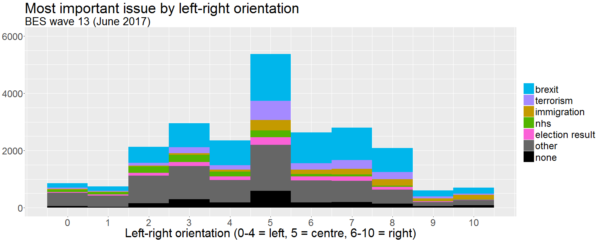
Why did people vote as they did in the June 2017 UK general election, and how might they vote in the next one — whenever it comes? One of the best sources of information on that question is wave 13 of the British Election Study: a very large survey conducted just after the election for a consortium of academics at the University of Manchester, the University of Oxford, and the University of Nottingham. Altogether 31196 respondents completed the survey, of whom 27019 (after weighting) answered the question ‘As far as you’re concerned, what is the SINGLE MOST important issue facing the country at the present time?’ and 23194 (again after weighting) identified themselves politically by positioning themselves on an eleven point scale from left to right. 21213 both placed themselves on the scale and gave their view on the most important issue. I’ve been working with this dataset for a little while, looking at how demographic variables predict perceptions of the most important issue (see my earlier post for my initial exploration of this topic), but here I’d like to focus on the association of particular issues with particular positions on the political spectrum:

mii-by-left-right-w13

Continue reading “The left, the right, the centre – and what they care about most”

Mapping the political Twittersphere

Public seminar by Daniel Allington
Starts: 16:00 15 Nov 2017
At: Mitchell Centre for Social Network Analysis, University of Manchester

Who follows British politicians on social media? Who stood with Ken Livingstone online? What would it be like to get all your political news from Twitter?

For over a year, I’ve been seeking answers to these questions and more using data scraping and a mixed methods approach centred on social network analysis. Social media have changed British political culture, creating quasi-celebrities out of figures who would otherwise have been condemned to the margins, and giving wide circulation to ideas long believed to be politically defunct – most alarmingly, the belief in an international conspiracy of Jews. In this seminar, I will present theoretical and methodological approaches to the large-scale study of online political culture, as well as sharing preliminary findings.

Open to all. Booking via the University of Manchester events website.