Why did people vote as they did in the June 2017 UK general election, and how might they vote in the next one — whenever it comes? One of the best sources of information on that question is wave 13 of the British Election Study: a very large survey conducted just after the election for a consortium of academics at the University of Manchester, the University of Oxford, and the University of Nottingham. Altogether 31196 respondents completed the survey, of whom 27019 (after weighting) answered the question ‘As far as you’re concerned, what is the SINGLE MOST important issue facing the country at the present time?’ and 23194 (again after weighting) identified themselves politically by positioning themselves on an eleven point scale from left to right. 21213 both placed themselves on the scale and gave their view on the most important issue. I’ve been working with this dataset for a little while, looking at how demographic variables predict perceptions of the most important issue (see my earlier post for my initial exploration of this topic), but here I’d like to focus on the association of particular issues with particular positions on the political spectrum:
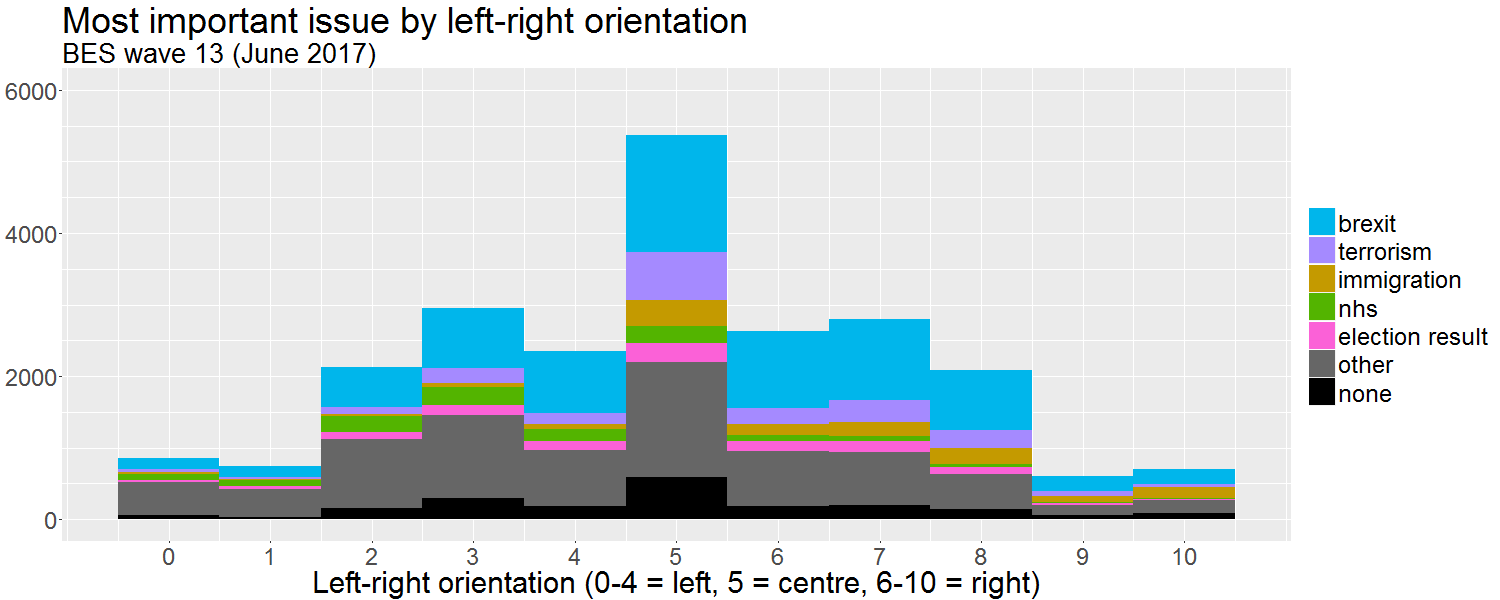
The first thing to note about the chart above is that the single largest group of respondents to the survey identified themselves as ‘centrists’ (to use the social media left’s new favourite term of abuse) by identifying their politics with a 5 on a scale of 0 to 10. This is a frequent finding of recent surveys, and indicates that, while the Conservative Party has shifted towards the nationalist right and the Labour Party has shifted towards the socialist left, the bulk of voters remain near the middle of the political spectrum. The second thing to note is that while Brexit — the big splash of pale blue — is the single biggest issue across the chart, chosen both by those who think it’s a good idea and by those who don’t, there are clearly some substantial left-right differences in terms of priorities. Green, for the NHS, appears to be concentrated on the left; orange, for immigration, on the right. We can see this better if we focus on those two issues alone and stretch or squash the bars so that we see not the weighted counts but the weighted percentage of people at each point on the left-right scale who chose each issue. So that the percentages for each issue can be more easily read, the bars are superimposed rather than stacked, and to make the trends more apparent, dashed lines have been added to smooth out the kinks with LOESS local regression:
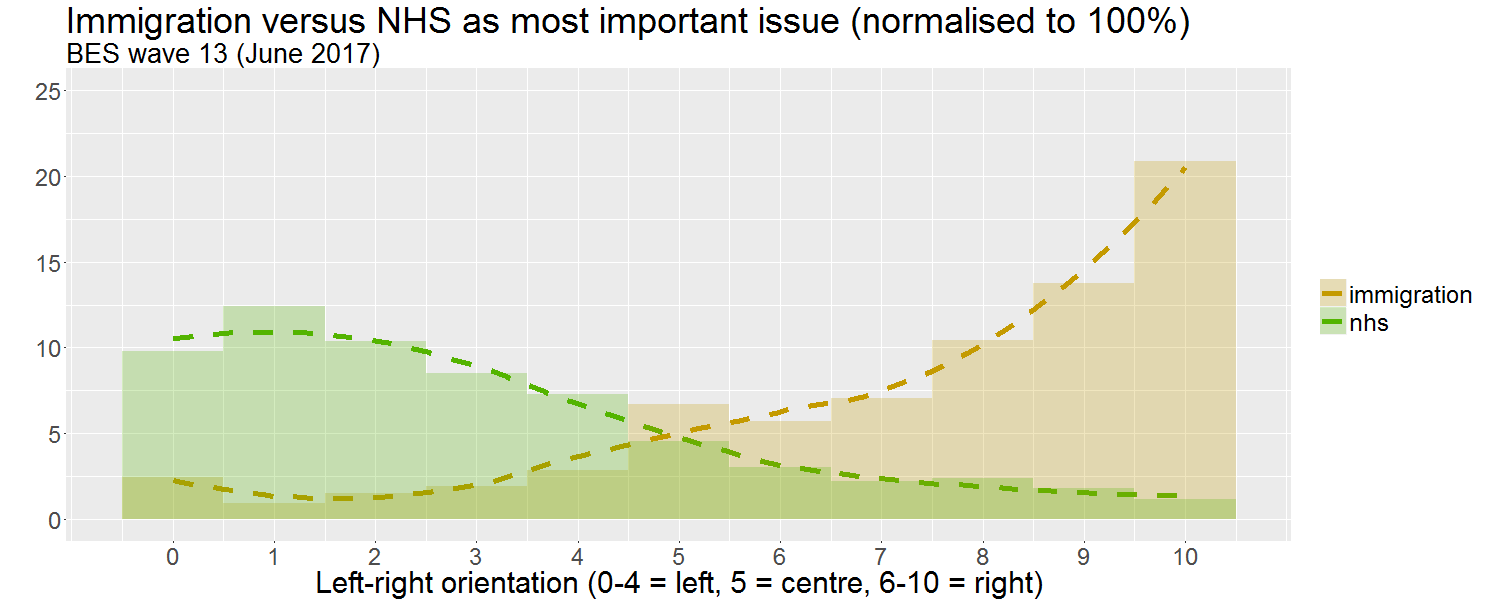
As we see, the proportion of respondents choosing the NHS as the most important issue increases towards the left and the proportion of respondents choosing immigration increases towards the right, with the two trends crossing in the middle. As the first chart emphasises, actual numbers of people identifying as what I shall call ‘solidly left’, i.e. 0-1 on the scale, or ‘solidly right’, i.e. 9-10, are much smaller than those identifying with the centre, i.e. 5, or the centre left and centre right, i.e. 2-4 and 6-8 respectively. However, this second chart suggests that each of the extremes speaks with much more of a unified voice than the centre does — and that the solid right does so more than the solid left. This interpretation again suggests itself when we compare the proportions choosing the single most popular most important issue, i.e. Brexit, and those choosing issues falling outside the top five, here coded as ‘other’:
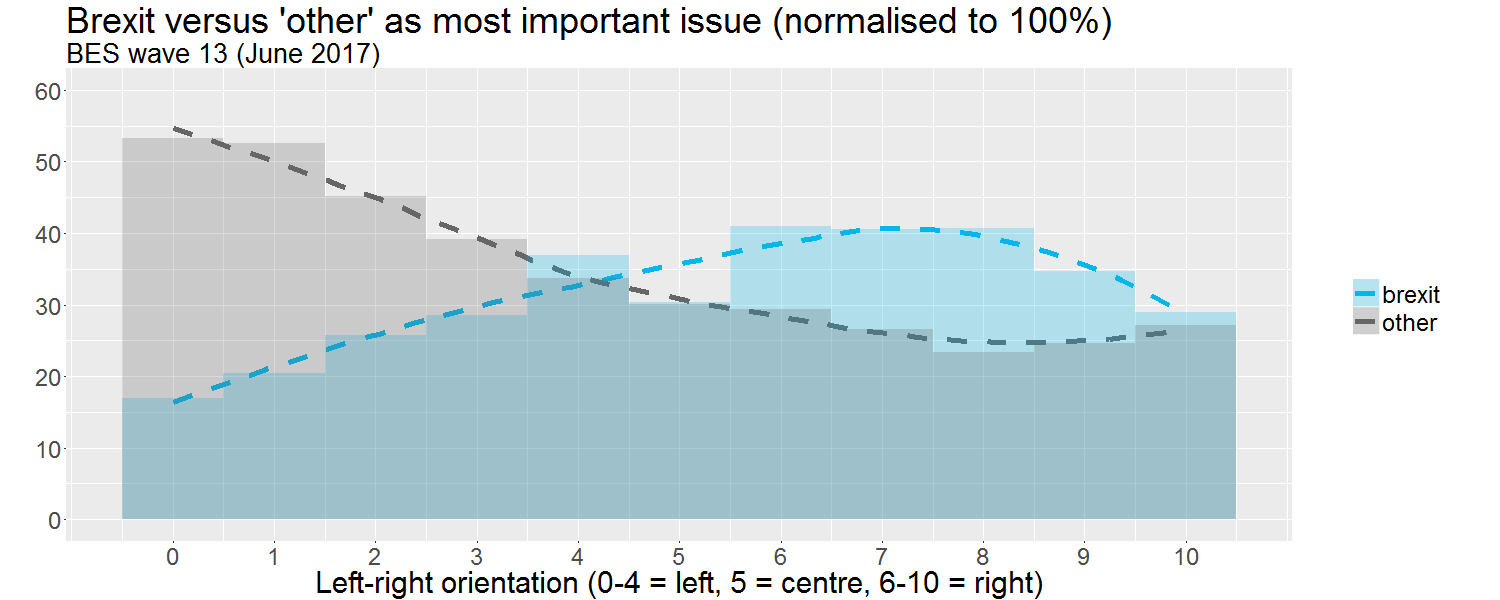
As this third chart shows, more than half the respondents identifying as solidly left wing chose issues outside the top five, while just over a quarter of those identifying as solidly right wing did the same. For an indication of those less frequently chosen most important issues — and of just how infrequently chosen the great majority of them are — we can look outside the top five to the top ten:
| Issue | Count | % | |
|---|---|---|---|
| 1 | brexit | 9017 | 33.5 |
| 2 | terrorism | 3515 | 13.1 |
| 3 | immigration | 1912 | 7.1 |
| 4 | nhs | 1688 | 6.3 |
| 5 | election result | 1473 | 5.5 |
| 6 | economy | 1408 | 5.2 |
| 7 | tories | 379 | 1.4 |
| 8 | inequality | 363 | 1.3 |
| 9 | environment | 289 | 1.1 |
| 10 | security | 238 | 0.9 |
All this hints at the structural problems faced by the UK’s political parties right now. Both the Labour Party and the Conservative Party have moved towards the extremes, leaving many of their usual voters behind with nowhere to go (yes, they could vote Liberal Democrat, but, with signs of a Liberal Democrat revival so thin on the ground, all they would likely be doing is leaving the choice between the two main parties to somebody else). The Conservative Party is divided between a large pragmatic centrist faction and a small but popular nationalist right wing faction, which its weak leader — a pragmatist pretending to be a nationalist — is unable to control. However, while the left may appear united behind the figure of Jeremy Corbyn, it is not at all united in its priorities — unlike the nationalist right with its clear focus on immigration.
In electoral terms, the situation may turn out to Labour’s advantage: it is the current strength of the right that prevents the Conservative Party from doing what it would so obviously be best advised to do, i.e. tracking back towards the centre to clean up on Labour among the voters now alienated by both major parties’ current positions. Does a Labour victory on these terms sound like the recipe for happiness, though? If Labour wins the next general election only because the right has short-sightedly bullied the Conservatives into adopting a position that swing voters feel they have no choice but to reject, it is likely to see its own support fragment as soon as it is faced with the central question of government, i.e. of how to allocate limited resources.
Interesting times.