Centrist dads, eh? (And presumably also centrist mums, although abusing them on behalf of the Absolute Boy might sound less like striking a feminist blow against patriarchy.) How wrong they were! They were so sure that Labour was going to lose the election, when as everyone now knows… well, actually, Labour did lose, but never mind — the centrists were still wrong. Slugs! By refusing to compromise on his left wing principles, Jeremy Corbyn shifted the Overton Window, opened up some clear red water between Labour and the Tories, and flipped social liberals for Socialism. In losing the election by a mere 55 seats out of a possible 650, he achieved total vindication for his strategy, and proved that he only has to do more of the same in order to find himself at the head of the Government after the next election (unlike — say — Gordon Brown, who lost by 48 seats and resigned, the melt). Onward, comrades! Onward to Socialism!
Now, I don’t believe that many people primarily choose whether or not to vote for a party to vote on the basis of how ‘left’ or ‘right’ they believe it to be. But ideas of leftness and rightness provide people with a way of summarising their relationships with political parties, and for this reason, I think it’s worth paying attention to the answers they give to survey questions about where they place themselves and the major parties on the left-right spectrum. And so we come to waves 5 and 12 of the British Election Study (or BES), in which a staggering 30725 and 34464 respondents took part immediately prior to the UK General Elections of 2015 and 2017. In the following chart, based on BES data, the grey areas show how people identified themselves, while the red and blue lines show how they typically situated the Labour Party and the Conservative Party on the same axis (respectively).1
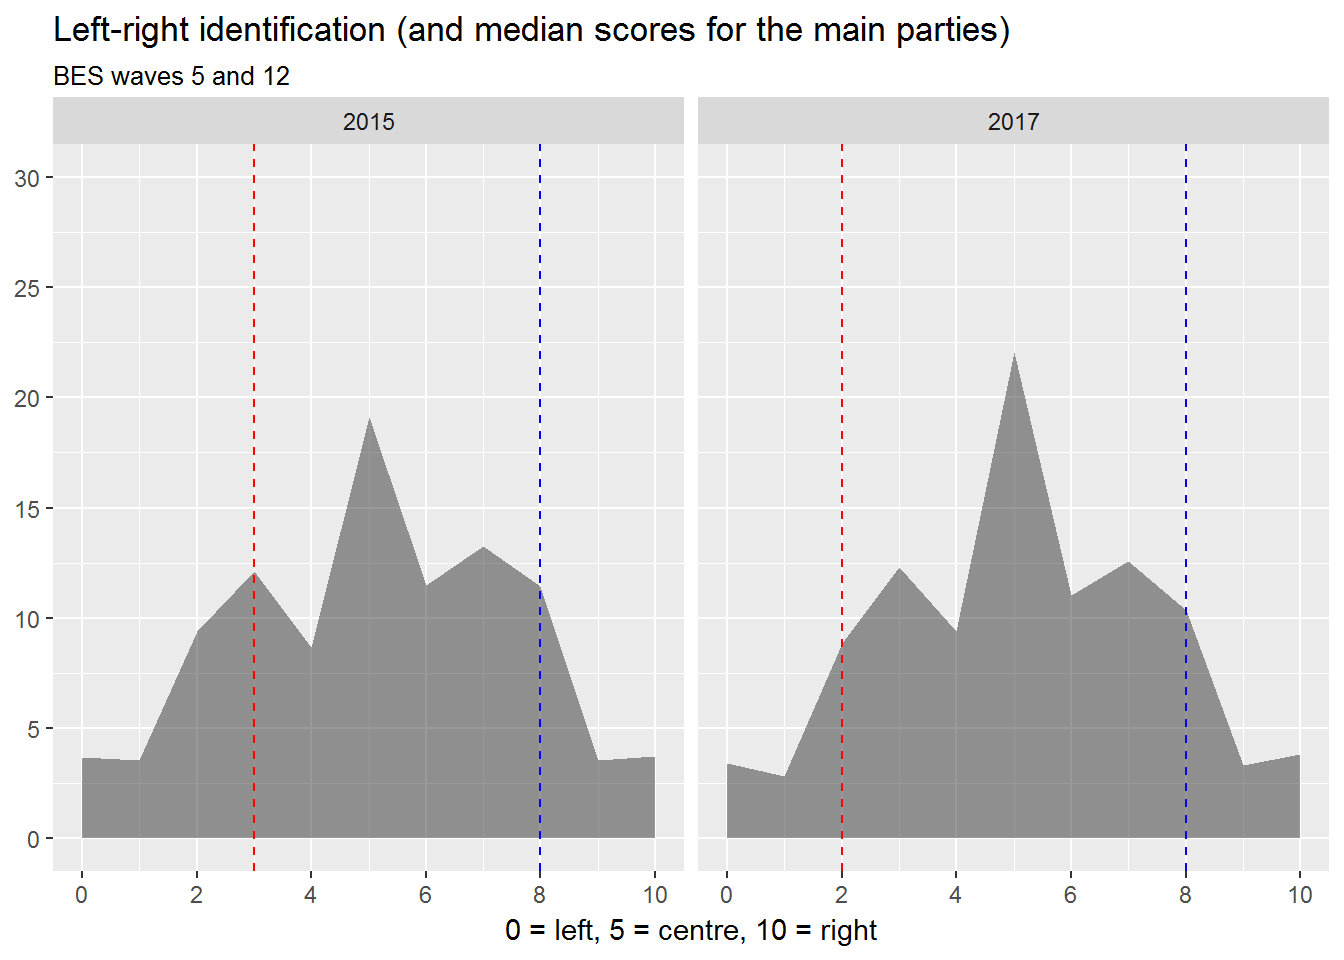
As this shows, the great majority of respondents do not identify as strongly left or right wing: 0 and 10 were the answers labelled ‘Left’ and ‘Right’ and were chosen by very few people, and everything else was a mixture of the two. 5 — the exact middle between the extremes — was not only the median (the answer chosen by the typical respondents found in the middle of the distribution) but the mode (the answer chosen by the most respondents overall). And it was chosen by more respondents just before the 2017 election than just before the 2015 election. Meanwhile, the median view of where the Labour Party stood changed from a 3 to a 2 on the scale. And the median view of the Conservative Party stood still. This doesn’t look like Jeremy Corbyn taking voters with him on his triumphant march to the Left; it looks like voters being left behind. His advantage is that the great migration to the Centre is occurring on the Right as well as the Left — although because the Right is more numerous (a point we shall come to below), the Tories still win on balance.
Let’s take a closer look at how views of the two main parties may have shifted. The following chart is the reverse of the one above, in that the vertical line shows where the median respondent placed him- or herself while the filled areas show the proportions of respondents who gave the parties each possible score:
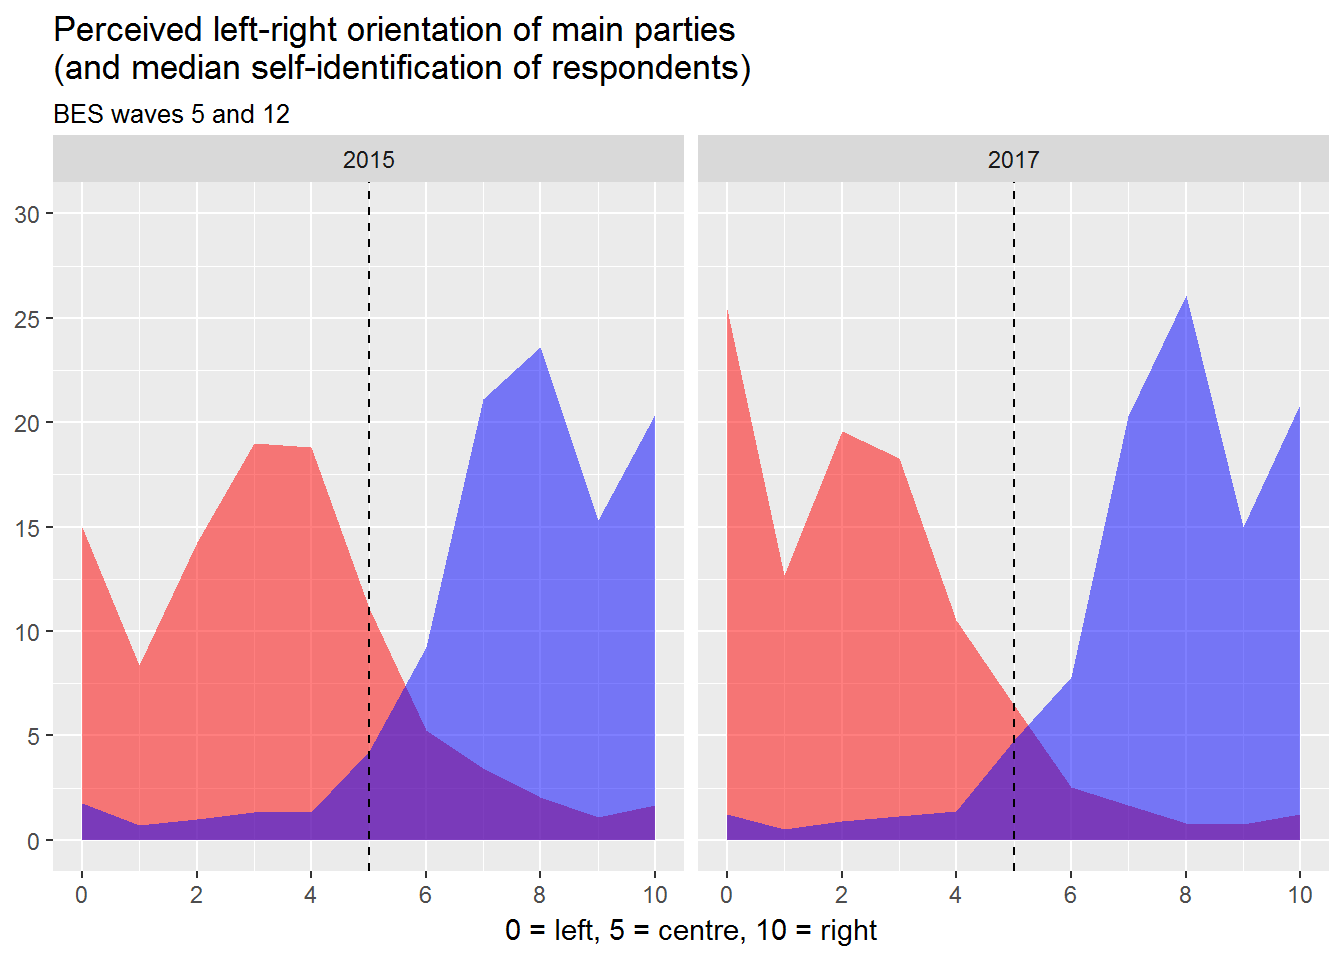
This shows what’s really behind that one-point leftward shift in median perceptions of the Labour Party: a startling rise in the proportion of people giving it a rating of 2, 1, and — above all — 0, and an equally dramatic drop in the proportion of people rating it as 4 or 5. Thus, while the median perception of the Labour Party’s ideological position shuffled from 3 to 2, the mode — the most common perception — bounded from 3 and 4 in 2015 to 0 in 2017. That’s a heck of a difference.
Meanwhile, perceptions of the Conservative Party didn’t really change at all. And the centre ground didn’t budge. Under Jeremy Corbyn, the Labour Party has given a substantial proportion of the population the idea that it’s as Left as Left can be at a time when the proportion of the population that sees itself the same way is several times smaller than that and when more and more people are identifying with the Centre. That would seem quite a risky strategy, relying on the Conservatives to alienate the centre ground in equal measure (as the election result shows that they very nearly managed to do).
Perhaps you’re now wondering how the Labour Party managed to do so well this June, winning its highest share of the vote since 1997. But one could equally well ask how the Conservative Party managed to do so well, winning its highest share of the vote since 1983. In identifying themselves with the centre and the two main parties with the extremes, respondents to the British Election Study were distancing themselves from both Labour and the Conservatives. But, like all voters, they had to go ahead and choose between the two — and choose, they did. Labour lost.
Now, Labour isn’t doing too badly in the polls at the moment, so — if nothing much happens from now on but the Conservatives’ making a mess of the Brexit negotiations (as they currently show every sign of being about to do) — there would appear to be a reasonably good chance of its winning the next election. But we should beware the assumption that the Labour Party will stand still while the Conservative Party destroys itself.
Labour is now under tremendous leftward pressure from within. That was abundantly clear both from the party’s 2017 annual conference in September and from its London conference last weekend. And whatever resistance the party’s centrist wing has been putting up (mostly bureaucratically and behind the scenes, it should be said), the Corbynsceptics are rapidly losing their grip on the levers of power. The party’s Scottish leadership election was won by the Momentum-backed candidate. And the three new elected seats on its National Executive Committee will probably soon be won by Momentum-backed candidates (one of them the owner of Momentum). So before the next election, we can expect to see deselections and loyalty tests for prospective Labour MPs, as well as the production of a rather more distinctly left wing manifesto (the 2017 manifesto was really just the 2015 manifesto with the addition of bribes for the party’s new middle class base, a partial return to the old obsession with nationalisation, and a pivot to the Right on immigration).
Now look at the charts above and think about how such a leftward shift is likely to be received. Not by political Twitter and Facebook, but by the electorate. That vast swathe of Far Left voters historically alienated by a Labour Party too close to the Centre? It’s not vast, it’s tiny. And if the cost of its support is the loss of the Centre, then its support is not worth having.
Perceived ideological distance from the two main parties
Before I wrap this essay up, there’s one more thing that I’d like to look into, which is how the two major parties were perceived by specific sections of the population (as defined by self-identified political position), rather than by the population as a whole. Let’s call those who rated themselves 0, 1, or 2 ‘Left’, and those who rated themselves 3 or 4 ‘Centre Left’. Let’s call those who rated themselves 10, 9, or 8 ‘Right’, and those who rated themselves 6 or 7 ‘Centre Right’. And all those unspeakable people who put themselves in the middle of the scale, let’s call them ‘Centre’. We can now do two things.
The first is to estimate the size of those groups as a proportion of the wider population. This will give us an idea of how much of an effect on the outcome of a general election each group’s votes would be likely to have.
The second is to measure the mean change in perceived ideological distance between members of each group and the two major parties. What I mean by perceived ideological distance is the numerical difference between where an individual places him- or herself on the left-right scale and where he or she places each party on that same scale. We can calculate the mean difference for each group in wave 5 and in wave 12, and then calculate the difference between the two means to see whether each group’s mean perceived distance from each party got larger or smaller between the two election campaigns. This should give us an idea of who thinks each party’s going in the right direction and who thinks it’s going in the wrong one.
Here are the results (percentages displayed to one decimal place, other figures to two):
| Ideological group | 2015 | 2017 | Lab 2015 | Lab 2017 | Con 2015 | Con 2017 | Lab | Con |
|---|---|---|---|---|---|---|---|---|
| left | 13.2 | 11.0 | 2.60 | 1.58 | 7.47 | 7.65 | -1.02 | 0.18 |
| centre.left | 16.5 | 15.8 | 1.37 | 1.44 | 4.82 | 4.99 | 0.07 | 0.17 |
| centre | 15.2 | 16.1 | 2.22 | 2.96 | 2.89 | 2.80 | 0.74 | -0.09 |
| centre.right | 19.6 | 17.2 | 3.75 | 4.77 | 1.35 | 1.33 | 1.02 | -0.02 |
| right | 14.8 | 12.7 | 6.52 | 7.40 | 1.38 | 1.23 | 0.88 | -0.15 |
| don’t know | 20.7 | 27.2 | n/a | n/a | n/a | n/a | n/a | n/a |
The above table shows several things. It shows that the proportion of respondents declaring themselves to be right or left wing fell between the 2015 and the 2017 campaigns, with the proportion declaring themselves to be bang in the middle very markedly rose. And it shows that more declared themselves to be on the Right or Centre Right than on the Left or Centre Left both in 2015 and in 2017. But it also shows that while each group’s perceived ideological distance from the Conservative Party shifted barely at all between the two campaigns (I would be reluctant to conclude that a change of a fifth or a tenth of a point really means anything, even in a survey of this size), their perceived distance from the Labour Party shifted dramatically. In 2017, those on the Left (the Left Left, not the Centre Left) saw the Labour Party as a whole point closer to them than they had in 2015, while those in the Centre and on the Right (including the Centre Right) saw it as between 0.7 of a point and a whole point futher away from them than they previously had. The Centre Left saw the party pretty much as it previously had. But it’s the Centre — and not the Left or even the Centre Left — that’s growing (no matter how much you hate your dad). This is bad news for the Tories too, of course: people identifying as Centre Right may not have got any further away from them, but fewer people are identifying as Centre Right, and more are identifying with the Centre (which sees itself as further from the Conservative Party than the Centre Right does). But it’s worse news for Labour, because the growing Centre sees Labour not only as more distant than the Centre Left does, but as more distant than it used to.
Let’s make a chart. Red shows a group of respondents’ change in distance from Labour, blue shows their change in distance from the Conservatives; a bar above the midline shows that a group perceives it to be more distant from itself than it did two years before, while a bar below the midline shows that it perceives it to be closer:
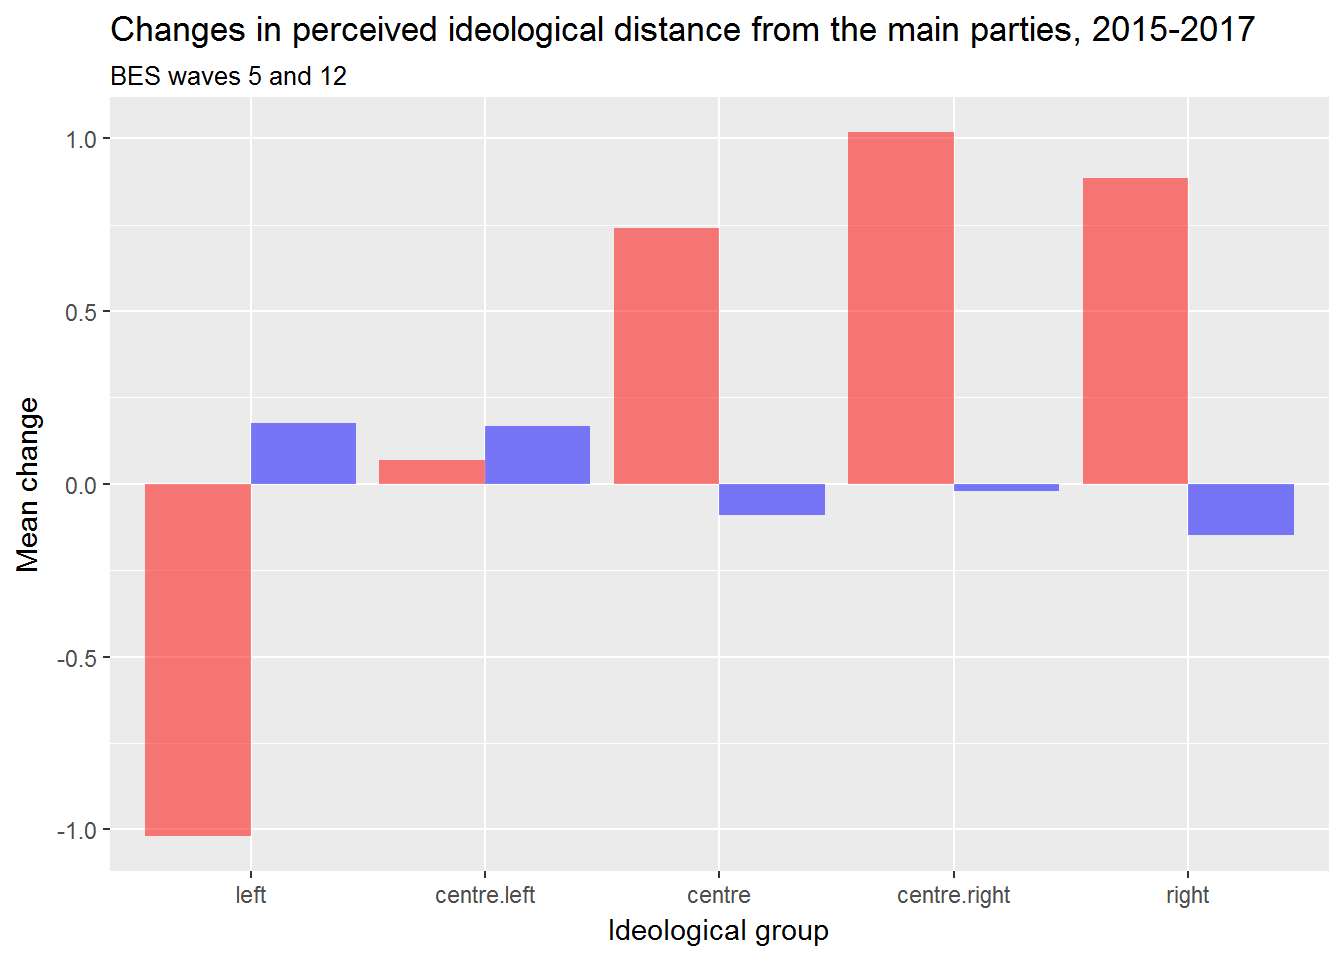
Take a good, long look at that, and remember that negative values are good news from the point of view of the party in question (meaning that people in a particular group perceived it as being closer to them than they previously had), while positive ones are bad news (meaning that they perceived it as being further away). The only ideological group that perceived the Labour Party to be ideologically closer to it just before the 2017 election than it had just before the 2015 election was the committed Left. A group that now appears to comprise less than 11% of the population (although probably more than half of the Labour Party’s current membership). And just look at the rest of the chart. What does this say about the Labour Party’s current direction, and the likely results if it continues down the same road? By all means tell yourself that Corbyn would be mainstream in Scandinavia: whether or not that’s true (and I don’t believe it is), he’s running for government in Britain, and the British public sees him as extreme.
From a Labour point of view, this is an accident waiting to happen, unless — and, quite possibly, even if — the Tories make good on their apparent promise to torpedo the economy for the sake of cutting immigration. I don’t suppose anyone on the Left will care, though; they’re too busy singing ‘Oh, Jeremy Corbyn’ and dreaming of the glorious day when the Water Board is renationalised.
-
From this point onwards, all calculations carried out for this essay were done using the British Election Study’s own weightings rather than raw counts.↩