The findings of wave 13 of the British Election Study are now out. Wave 13 was conducted just after the June 2017 General Election, and analysts all over the country have been crunching the numbers. This is my contribution, and looks at answers to the question, ‘As far as you’re concerned, what is the SINGLE MOST important issue facing the country at the present time?’ This was a free text question, so respondents were able to provide whatever answers they wished, without restriction. What I wanted to find out was whether people of different NRS social grades would express different concerns in their answers to this question. We already know that Labour gained vote share from the Conservatives in more middle class areas and lost it to them in working class areas. Might analysis of those ‘most important issues’ give a hint as to the different priorities of people of different social classes?
I’ll get some analysis of the numbers up before long, but — for now — here’s the chart:
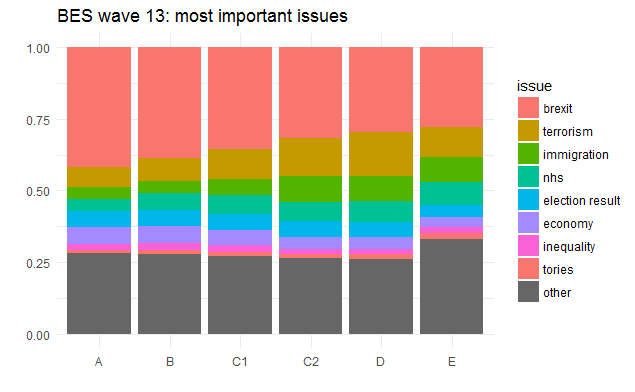
Brexit comes top in every group, but as we move across the social grades from A to D, the proportion of respondents giving it as the most important issue declines and the proportion of respondents giving terrorism or the NHS as the most important issue increases; social grade E continues this trend with regard to the NHS, but reverses it with regard to terrorism. More respondents in ‘working class’ social grades (C2DE) than in ‘middle class’ social grades (ABC1) cite immigration as the most important issue, while fewer cite inequality (which in the recoding scheme used here includes poverty and homelessness) or the economy (which in the recoding scheme used here includes employment, unemployment, cost of living, and wages).
More respondents in the lowest social grade (E) gave ‘other’ responses, i.e. answered in ways in which very few people answered overall. Unpicking answers outside the top eight is problematic: although this was a very big survey, even the ninth most commonly chosen ‘most important issue’ overall (i.e. the environment) was cited by a mere 286 people, and — to make matters worse — grade E had the fewest respondents overall.
Total numbers per grade who answered the ‘most important issue’ question in this wave are as follows, and are more than large enough to let us make robust inferences about more commonly chosen answers, however:
| A | B | C1 | C2 | D | E |
| 3968 | 5485 | 7790 | 4586 | 2685 | 3451 |
Because many respondents expressed the same ideas in different ways (or mis-typed the same words), it was necessary to do quite a bit of re-coding before visualising the data. If you want to see how this was done and what decisions I made, you can take a look at the R notebook I used.