Importing National Student Survey data with R (or: how doing things programmatically helps to avoid mistakes)

I recently started to do some work with NSS (National Student Survey) data, which are available from the HEFCE website in the form of Excel workbooks. To get the data I wanted, I started copying and pasting, but I quickly realised how hard it was going to be to be sure that I hadn’t made any mistakes. (Full disclosure: it turns out that actually I did make some mistakes, e.g. once I left out an entire row because I hadn’t noticed that it wasn’t selected.) Using a programming language such as R to create a script to import data requires much more of an investment of time upfront than diving straight in and beginning to copy and paste but the payoff is that once your script works, you can use it over and over again – which is why I now have several years’ worth of NSS data covering all courses and institutions, from which I can quite easily pull out whichever numbers I want using a dplyr filter statement (as long as I am prepared to take account of irregularities e.g. in institutions’ names from one year to the next – which would also be necessary when doing things by point-and-click).

For example, looking at how all institutions performed in my particular discipline with regard to the four NSS questions relating to teaching quality, I can see that Media Studies at the University of the West of England managed the quite remarkable feat of rising from 68th place in 2015 to 2nd place in 2016 before falling back to 53rd place in 2017. To visualise only these four questions in relation to this subject at this institution over the whole time period for which I have data, I can filter out everything relating to other disciplines and other institutions with a single statement, and then use ggplot to represent each of the four variables that I’m interested in with a different coloured line:

Student perceptions of teaching quality in Media Studies at UWE Bristol

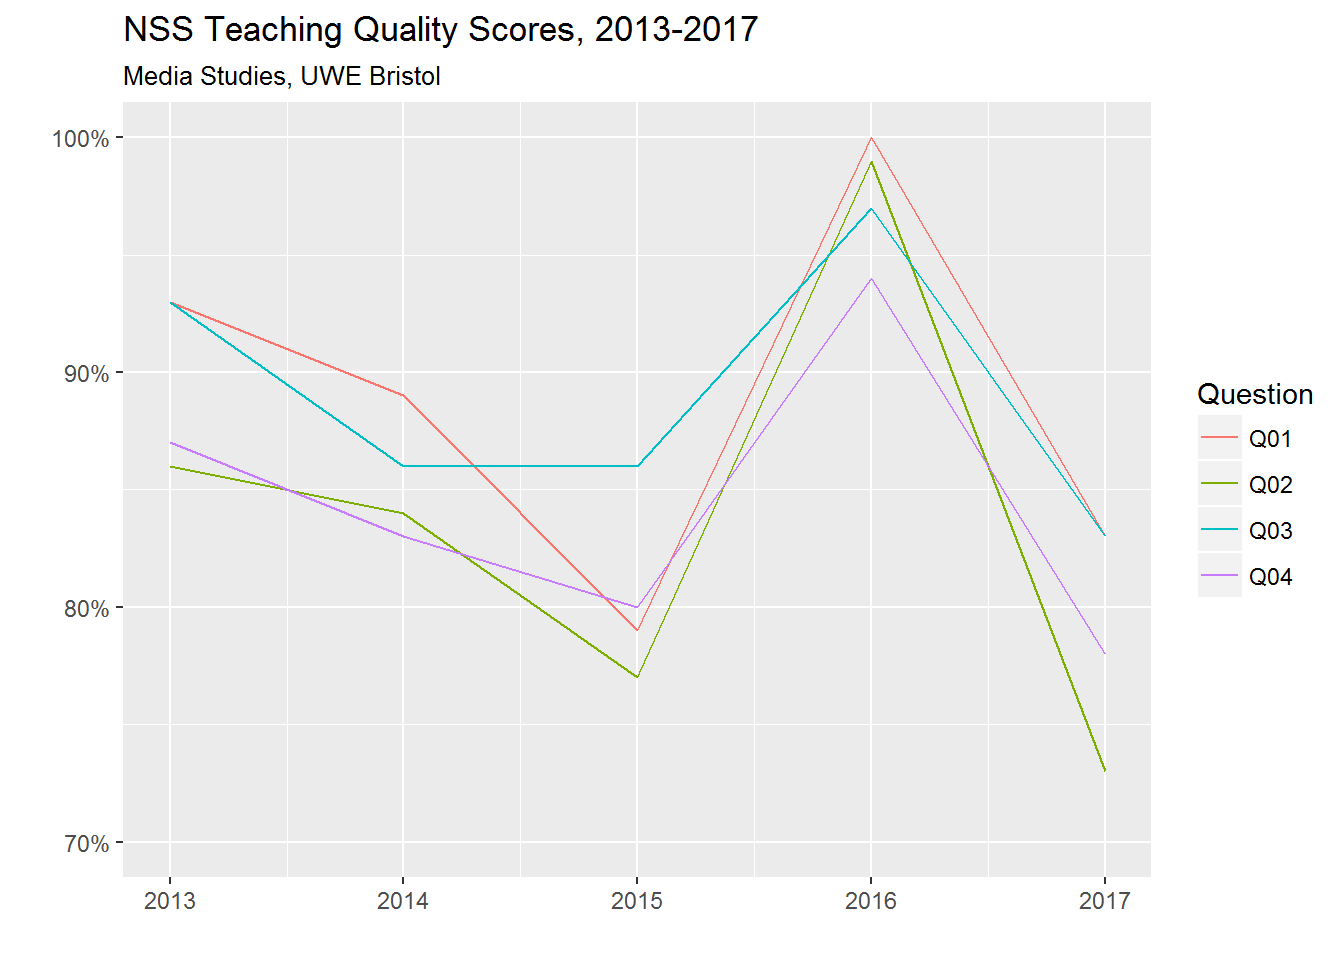
How could such a dramatic rise and fall occur? Maybe someone who still works at UWE would be better placed to explain. But the general question of what drives student perceptions of teaching quality is one that I’m interested to explore as a researcher – and I’ll be posting thoughts and findings here as and when.

In the meantime, here’s my code, presented as an example of how the automation of error-prone tasks can take some of the uncertainty out of the research process. You probably aren’t interested in working with this particular dataset, but you may have other datasets that you would like to deal with in the same way. Yes, it looks complicated if you’re not used to scripting – but the code is actually quite simple, and the thing is that I was able to build it up iteratively, by adding statements, running the script as a whole, noticing what went wrong, and then fixing whatever it was, one step at a time. (The code is very heavily commented, to give a non-coder an idea of what those steps were and what sort of thinking is typically involved in taking a code-based rather than point-and-click-based approach to data importing etc.)

Continue reading “Importing National Student Survey data with R (or: how doing things programmatically helps to avoid mistakes)”

‘The usual suspects’: Euler diagrams of letter signatories as a practical application for set theory

The day before the 2017 Labour Party Conference in Brighton, Labour Vision published an essay in which I argued that responsible non-Jews on the Left should take note of majority Jewish opinion, and not ignore it in favour of tiny minority groups on the fringes of the Jewish community whose opinion happens to be more convenient for Leftists. What actually happened at the conference is history — and quite unpleasant history at that (for details, I recommend reading both Marcus Dysch’s overview of events and David Collier’s eyewitness account). There’s much more to be said on the topic, and I’ll get around to saying some of it before long, but for now, I’d like to revisit the odd little centrepiece of my Labour Vision essay: the analysis of signatories to four letters opposing action against antisemitism. (tl;dr: There are very few Jews who are committed anti-Zionists, but the anti-Zionist movement needs them in order to maintain the impression of not being anti-Jewish, so a lot of the same names get recycled between different open letters to the press. Also, a tutorial on how to make Euler diagrams in R. Something for everyone?)

euler_diagram

Continue reading “‘The usual suspects’: Euler diagrams of letter signatories as a practical application for set theory”

RStudio, Jupyter, Emacs, Vim: nothing that works properly is easy to use and nothing that is easy to use works properly

EDIT: Some of the problems described below are mitigated or resolved by not saving to a network drive. That doesn’t help with all the problems, though. RStudio no longer hangs for minutes at a time and I can now use version control, but the cursor still becomes uncontrollable in long Markdown documents. Also the university’s PCs are set up in such a way that students have to save to a network drive, which means that this is a (partial) fix for me as a researcher but not for me as a teacher.

So I am preparing to teach quantitative analysis of social media data using R, the open source language for statistical programming. I usually do anything code-related in Emacs, because I already know how to use Emacs and you can do everything code-related in Emacs and I don’t want to install and learn the quirks of loads of different IDEs. But that argument won’t make sense from the point of view of my students, firstly because they won’t need to do everything code-related, they’ll just need to create R notebooks, and secondly because they don’t already know how to use Emacs, and learning how to use Emacs is hard because Emacs is weird.

Continue reading “RStudio, Jupyter, Emacs, Vim: nothing that works properly is easy to use and nothing that is easy to use works properly”