Voters in the 2017 general election – and how they voted previously

This is the third and final part of my preliminary analysis of groups of voters defined by the choices they made in the 2015 general election, the 2016 European Union membership referendum, and the 2017 general election (c.f. Stephen Bush’s nine voter groups), using an English subset of responses to the British Election Study’s post-election face-to-face survey. In the first part, I looked at the ten largest groups, from Conservative-Leave-Conservative to Conservative-Remain-Labour, both in terms of their size and in terms of their self-declared likelihood to vote for various parties in future, and found that Labour Remainers were not only more numerous but (on their own assessment) more likely to be poached than Labour Leavers, while the smaller group of Conservative Remainers who had switched to voting Labour were quite likely to switch again. In the second part, I looked at six groups of voters who had in common that they could have voted but did not in the 2015 general election, finding that most of them did not vote either in the 2016 referendum or the 2017 general election, and that only the minority who voted Remain in the 2016 referendum were more likely than not to have voted in the 2017 general election.

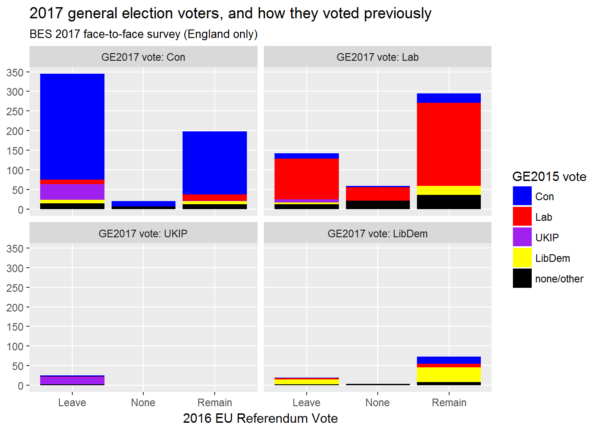
To finish up for now, here’s a single chart showing all voter groups which participated in the 2017 general election (weighted by demographic group and by 2017 vote). Each quarter of the chart below shows the members of the sample who voted for one of the four main parties. These voters are further subdivided into columns to show how they voted in the referendum and into coloured blocks to show who they voted for in 2015 (note that black covers both non-voting and voting outside the four main parties, which most often meant voting Green as the data are from England only):

Voters in the 2017 general election - and how they voted previously

Continue reading “Voters in the 2017 general election – and how they voted previously”
Non-voters from the 2015 general election and what they did next

On Friday, I posted some analysis of groups of English voters defined by the combinations of choices they made in a succession of votes. That was the first installment of a multi-part response to Stephen Bush’s recent article on why we should stop focusing so obsessively on people who voted Labour in 2015 and then voted to leave the European Union in 2016. I’d now like to take a look at those who didn’t vote at all in the 2015 general election.

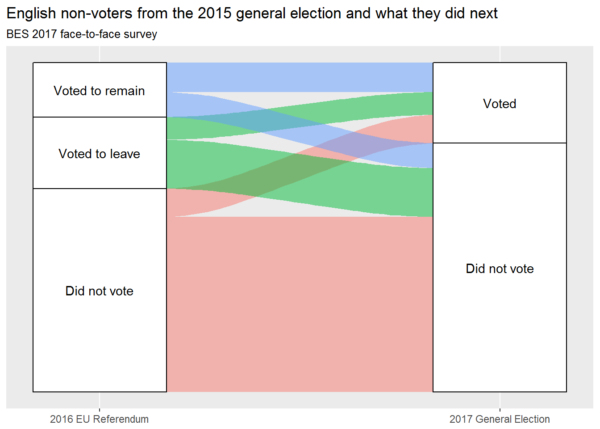
Excluding those who did not vote because they were ineligible, there were 290 GE2015 non-voters in the dataset that I’m using: an English subset of the post-election 2017 face-to-face survey carried out as part of the long-running and hugely respected British Election Study. The 290 become 311 or more if we weight for demographic group, as I did for Friday’s analysis – which indicates that the non-voters were from demographic groups that were under-represented in the sample as a whole. (It’s only slightly less difficult to get non-voters to answer a survey than it is to get them into a polling booth, as we see from the fact that just 15% of the sample did not vote in an election with 66% turnout.) But because 290 is a small sample and weighting tends to magnify the effect of sampling error, I’ve used unweighted counts throughout this post (not that weighting made an appreciable difference to any of the patterns I will talk about below). The following alluvial diagram (created using the R package, ggalluvial) tracks the voting behaviour of sampled 2015 non-voters post-2015:

The subsequent voting behaviour of 2015 General Election non-voters

Continue reading “Non-voters from the 2015 general election and what they did next”

Ten voter groups: combinations of EU referendum and general election votes in the BES 2017 face-to-face survey

Like many, I read with interest Stephen Bush’s recent article on ‘The nine voter groups who are more important than Labour Leavers’. If Bush were a grant awarding institution, there would be money available for researching those groups. Well, he isn’t, so there isn’t, but I like a challenge so I’m going to make a start anyway – using open data from the British Election Study (henceforth, BES). To be more specific, I’ll be using the BES 2017 face-to-face survey, which was conducted after the election and uses what should probably be considered a more genuinely random sample than the online waves.

Continue reading “Ten voter groups: combinations of EU referendum and general election votes in the BES 2017 face-to-face survey”

The left, the right, the centre – and what they care about most

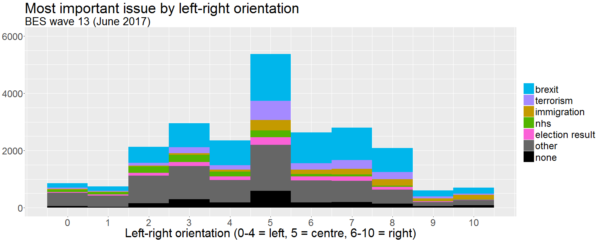
Why did people vote as they did in the June 2017 UK general election, and how might they vote in the next one — whenever it comes? One of the best sources of information on that question is wave 13 of the British Election Study: a very large survey conducted just after the election for a consortium of academics at the University of Manchester, the University of Oxford, and the University of Nottingham. Altogether 31196 respondents completed the survey, of whom 27019 (after weighting) answered the question ‘As far as you’re concerned, what is the SINGLE MOST important issue facing the country at the present time?’ and 23194 (again after weighting) identified themselves politically by positioning themselves on an eleven point scale from left to right. 21213 both placed themselves on the scale and gave their view on the most important issue. I’ve been working with this dataset for a little while, looking at how demographic variables predict perceptions of the most important issue (see my earlier post for my initial exploration of this topic), but here I’d like to focus on the association of particular issues with particular positions on the political spectrum:

mii-by-left-right-w13

Continue reading “The left, the right, the centre – and what they care about most”

‘Middle class problems’? Social grade and the ‘most important issue’ in wave 13 of the British Election Study

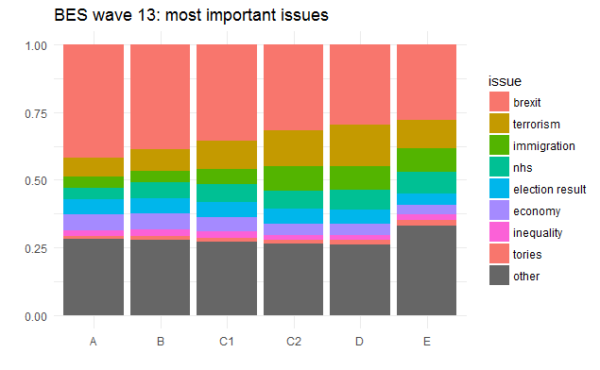
The findings of wave 13 of the British Election Study are now out. Wave 13 was conducted just after the June 2017 General Election, and analysts all over the country have been crunching the numbers. This is my contribution, and looks at answers to the question, ‘As far as you’re concerned, what is the SINGLE MOST important issue facing the country at the present time?’ This was a free text question, so respondents were able to provide whatever answers they wished, without restriction. What I wanted to find out was whether people of different NRS social grades would express different concerns in their answers to this question. We already know that Labour gained vote share from the Conservatives in more middle class areas and lost it to them in working class areas. Might analysis of those ‘most important issues’ give a hint as to the different priorities of people of different social classes?

I’ll get some analysis of the numbers up before long, but — for now — here’s the chart:

bes_w13_MII_by_grade

Continue reading “‘Middle class problems’? Social grade and the ‘most important issue’ in wave 13 of the British Election Study”

Of Brexit, Trump, and demographics: a reaction against modernity and an urgent need for a new politics

There’s much to be said about the UK’s decision to leave the European Union and the US’s decision to elect Donald Trump as president: above all, that we have in neither case seen a simple victory of ‘right’ over ‘left’. Leading conservatives in both countries had opposed the result that ultimately came to pass, and in both countries, the result was followed by a stock market fall, indicating that investors expected the supposedly ‘right wing’ option to be bad for business.

But for now I’d like to observe some important transatlantic similarities in the demographics of the winning and losing sides.

Continue reading “Of Brexit, Trump, and demographics: a reaction against modernity and an urgent need for a new politics”

Sometimes rhetoric has consequences

When you shout BREAKING POINT over and over again, you don’t get to be surprised when someone breaks. When you present politics as a matter of life and death, as a question of national survival, don’t be surprised if someone takes you at your word. You didn’t make them do it, no, but you didn’t do much to stop it either.

Sometimes rhetoric has consequences. If you spend days, weeks, months, years telling people they are under threat, that their country has been stolen from them, that they have been betrayed and sold down the river, that their birthright has been pilfered, that their problem is they’re too slow to realise any of this is happening, that their problem is they’re not sufficiently mad as hell, then at some point, in some place, something or someone is going to snap. And then something terrible is going to happen.

Alex Massie, 2016

Continue reading “Sometimes rhetoric has consequences”

Impending doom and media effects

In a few days’ time, my country will hold a referendum on whether to stay inside the European Union or to leave it. I am fairly convinced that the outcome will be a victory for the ‘leave’ camp.[1] London and Scotland will vote to stay in, the UK as a whole will vote to leave (led by those parts that have benefited most from EU membership), and a second referendum on Scottish independence will probably follow, in which case Scotland will almost certainly vote to leave the UK in order to stay in the EU. England will be left behind with the relatively impoverished Wales and Northern Ireland – both of which will lose their EU funding, as will the economically marginal parts of England that the London-based government will continue to do its best to ignore, as it has done for many years.

Continue reading “Impending doom and media effects”