The left, the right, the centre – and what they care about most

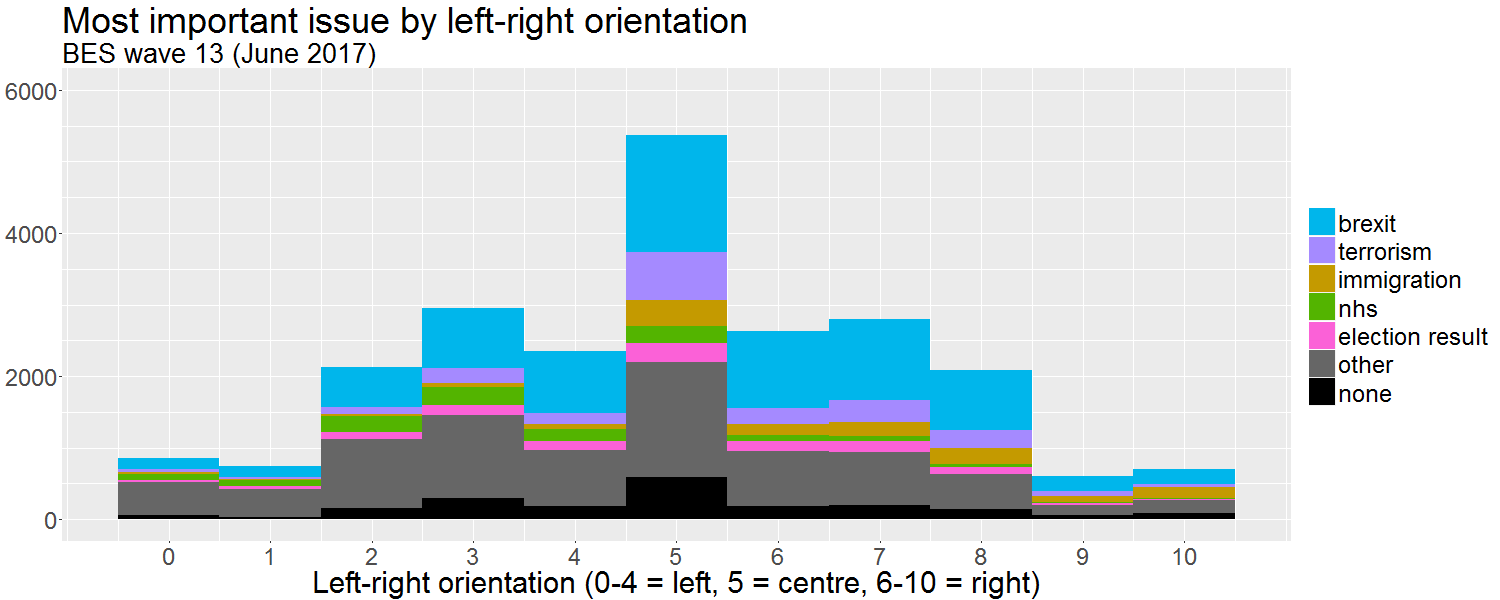
Why did people vote as they did in the June 2017 UK general election, and how might they vote in the next one — whenever it comes? One of the best sources of information on that question is wave 13 of the British Election Study: a very large survey conducted just after the election for a consortium of academics at the University of Manchester, the University of Oxford, and the University of Nottingham. Altogether 31196 respondents completed the survey, of whom 27019 (after weighting) answered the question ‘As far as you’re concerned, what is the SINGLE MOST important issue facing the country at the present time?’ and 23194 (again after weighting) identified themselves politically by positioning themselves on an eleven point scale from left to right. 21213 both placed themselves on the scale and gave their view on the most important issue. I’ve been working with this dataset for a little while, looking at how demographic variables predict perceptions of the most important issue (see my earlier post for my initial exploration of this topic), but here I’d like to focus on the association of particular issues with particular positions on the political spectrum:

mii-by-left-right-w13

Continue reading “The left, the right, the centre – and what they care about most”

Who won the Twitter election? Part ii: ‘faithful’ and ‘promiscuous’ followers

Last month, I published an analysis of candidates’ public Twitter followers immediately before the General Election. As I showed, Conservative candidates tended to have more public followers than Labour candidates — but once we control for whether candidates had or had not previously been Members of Parliament, we find that Labour candidates tended to have more public followers than Conservative candidates. SNP candidates tended to have more public followers than Conservative or Labour candidates, although that finding was not statistically significant after controls because of the low numbers involved.

This does not, however, address the question of which party’s candidates had more public followers in total — nor the much more subtle question of how many of each party’s candidates’ public followers exclusively followed candidates of that party, and how many also followed candidates of other parties. To answer that question, we need to know who the candidates’ followers were. Fortunately, I do:

Total public Twitter followers of all candidates in the 2017 General Election, showing how many followed each party's candidates exclusively (solid colour) and how many also followed the candidates of one or more additional parties (transparent)
Total public Twitter followers of all candidates in the 2017 General Election, showing how many followed each party’s candidates exclusively (solid colour) and how many also followed the candidates of one or more additional parties (transparent)

Continue reading “Who won the Twitter election? Part ii: ‘faithful’ and ‘promiscuous’ followers”

Who won the Twitter election? Part i: followers, and which party’s candidates tended to have more of them

Just over half a year ago, the Telegraph carried out an analysis appearing to show that ‘the Labour leader’s shadow cabinet d[id]n’t have as wide a reach as their opposite numbers on Twitter’. This conclusion was arrived at by comparing ministers and shadow ministers whose roles were directly parallel: ‘[Jeremy] Corbyn has more followers than Theresa May, while Diane Abbott saw off Amber Rudd, John McDonnell beat Philip Hammond and Keir Starmer edged out David Davis’, but with regard to the others, ‘the Government enjoyed a clean sweep of the board’ (ibid.).

This is interesting, but I don’t find it satisfactory. The Conservative Party’s best known and most popular politicians were mostly in the cabinet. But while Corbyn himself remains the Labour Party’s biggest social media star, its second- and fourth-most popular MPs on Twitter were and are excluded from the shadow cabinet by virtue of not being Corbyn loyalists, while the third-most popular has technically remained a shadow cabinet member but was excluded from the Telegraph’s analysis by virtue of having no Tory opposite number.

So what happens if we look at the public followers of all prospective parliamentary candidates? This happens. (Figures collected in the week before the General Election for a different purpose and re-used here. Small parties excluded. If you want code, here’s my notebook. Hat tip to Democracy Club for its crowdsourced list of politicians’ social media accounts.)

Twitter following by party, GE 2017

Continue reading “Who won the Twitter election? Part i: followers, and which party’s candidates tended to have more of them”

Did Jewish Labour voters turn towards the Conservative Party or the Liberal Democrats in 2017?

Last week, I published a blog post showing that North London constituencies bucked the national trend by swinging less heavily towards Labour than might otherwise have been expected. I have since repeated the analysis, looking at changes in votes for the Labour Party, Conservative Party, and Liberal Democrats in the twenty British constituencies with the highest Jewish populations. The findings of that analysis are consistent with the view that many British Jews who had previously voted Labour turned away from the party in response to its continued mishandling of its ongoing antisemitism crisis, but — contrary to some indications that ‘the Tories were likely to take huge swathes of Jewish votes’ — they did not turn towards the Conservative Party. Instead, such voters seem more likely to have voted Liberal Democrat.

2015-2017 changes in vote share for the Labour Party, Conservative Party, and Liberal Democrats in the 20 British constituencies with the highest Jewish populations

Continue reading “Did Jewish Labour voters turn towards the Conservative Party or the Liberal Democrats in 2017?”

The electoral cost of left wing antisemitism

EDIT (2 Jul 2017): See also my subsequent analysis of the Labour, Conservative, and Liberal Democrat vote in the 20 British constituencies with the highest Jewish populations

EDIT (12 April 2019): I also analysed 2018 local election results in Barnet: the local authority with the highest Jewish population in the UK. This analysis was reported on the front page of the Jewish Chronicle on 10 May 2018.  

The UK’s 2017 general election campaign was marred by overt racism against Jews on the part of some supporters of Jeremy Corbyn, perhaps most dramatically expressed in the erection of a vast antisemitic banner in a central location in the city of Bristol. Moreover, it came hard on the heels of the Labour Party’s failure to discipline Corbyn’s long-term ally, Ken Livingstone over his appalling historical distortions with regard to Adolf Hitler and the Zionist movement.

The Labour leadership is riding high at the moment, thanks to its less-severe-than-expected defeat in the face of an utterly shambolic Tory campaign. However, there’s been some discussion as to the electoral cost of its failures with regard to the Jewish community (see e.g. Marcus Dysch in the Jewish Chronicle).

Can we put a figure on that cost? If we look at voting in the part of the country with the highest Jewish population, we find that two percent more Jews in a constituency implies a roughly one percent smaller rise in Labour’s vote share.

Change in Labour vote share in North London constituencies, and their Jewish population

Continue reading “The electoral cost of left wing antisemitism”