Misogyny is intrinsic to a Far Left built on bullying

The journalist, Sam Kriss — a member of the Labour Party — has been accused of sexual harassment. So has the journalist, Rupert Myers — a member of the Conservative Party. And so, on the other side of the Atlantic, have the movie mogul, Harvey Weinstein — a supporter of the Democrats — and the TV host, Bill O’Reilly — a supporter of the Republicans. There is nothing specifically left or right wing about misogyny.

But there is something very specific indeed about the misogyny of the contemporary British Far Left: something very specific that is very specifically denied when Corbyn’s cheerleaders enthuse that ‘Corbynite slang is remarkably unproblematic in its derivation’, or insinuate — however ridiculously — that ‘centrists’ are particularly prone to transphobia, or suggest, with unintentional irony, that the real threat faced by left wing women is that of ‘centrist dads’ who ‘want to educate you and hate fuck you’. (Honestly, there’s nothing new about the sexual abuse of women on the far left by men more highly placed in the far left’s brutal hierarchy.)

Continue reading “Misogyny is intrinsic to a Far Left built on bullying”
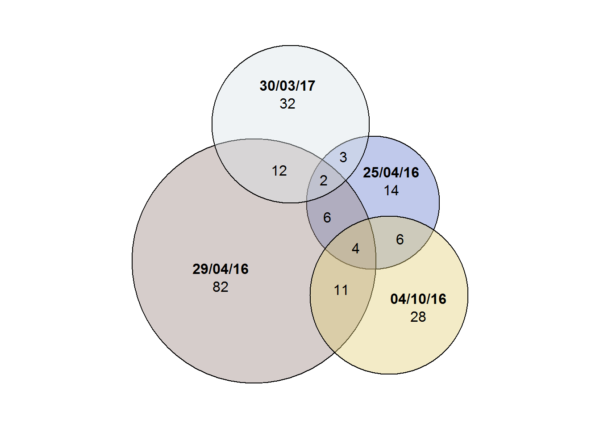
‘The usual suspects’: Euler diagrams of letter signatories as a practical application for set theory

The day before the 2017 Labour Party Conference in Brighton, Labour Vision published an essay in which I argued that responsible non-Jews on the Left should take note of majority Jewish opinion, and not ignore it in favour of tiny minority groups on the fringes of the Jewish community whose opinion happens to be more convenient for Leftists. What actually happened at the conference is history — and quite unpleasant history at that (for details, I recommend reading both Marcus Dysch’s overview of events and David Collier’s eyewitness account). There’s much more to be said on the topic, and I’ll get around to saying some of it before long, but for now, I’d like to revisit the odd little centrepiece of my Labour Vision essay: the analysis of signatories to four letters opposing action against antisemitism. (tl;dr: There are very few Jews who are committed anti-Zionists, but the anti-Zionist movement needs them in order to maintain the impression of not being anti-Jewish, so a lot of the same names get recycled between different open letters to the press. Also, a tutorial on how to make Euler diagrams in R. Something for everyone?)

euler_diagram

Continue reading “‘The usual suspects’: Euler diagrams of letter signatories as a practical application for set theory”

Imaginary (Jewish) friends

It is an article of faith for many on the British Left that measures to combat left wing antisemitism are in reality measures to combat Labour Party leader Jeremy Corbyn: attempts promoted by the fiendish ‘Israel Lobby’, and opposed by Jews. Yes, by Jews. You know the Jews I mean: maybe not the Jews you’ve actually met, but, as Chaminda Jayanetti put it, ‘the Good Jew[s] – the Perfect Jew[s]. The Manic Pixie Dream Jew[s]. The Jew[s] to be put on a placard as evidence of how Not All Jews support Israel.’ There’s a certain kind of Leftist who needs those Jews.

Continue reading “Imaginary (Jewish) friends”

Who won the Twitter election? Part ii: ‘faithful’ and ‘promiscuous’ followers

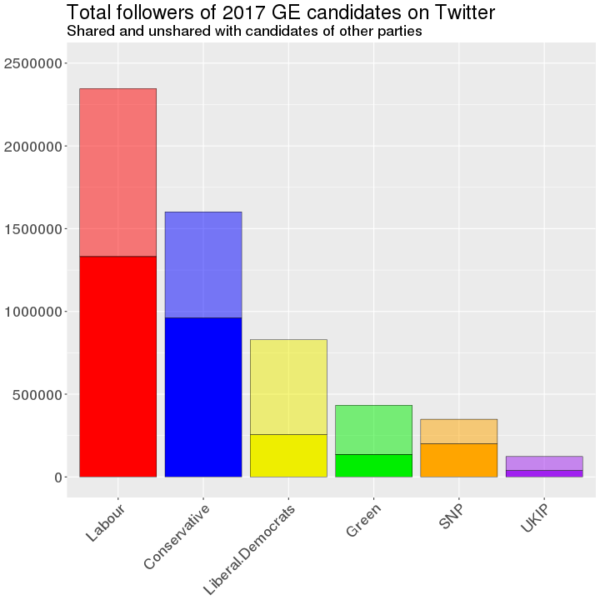
Last month, I published an analysis of candidates’ public Twitter followers immediately before the General Election. As I showed, Conservative candidates tended to have more public followers than Labour candidates — but once we control for whether candidates had or had not previously been Members of Parliament, we find that Labour candidates tended to have more public followers than Conservative candidates. SNP candidates tended to have more public followers than Conservative or Labour candidates, although that finding was not statistically significant after controls because of the low numbers involved.

This does not, however, address the question of which party’s candidates had more public followers in total — nor the much more subtle question of how many of each party’s candidates’ public followers exclusively followed candidates of that party, and how many also followed candidates of other parties. To answer that question, we need to know who the candidates’ followers were. Fortunately, I do:

Total public Twitter followers of all candidates in the 2017 General Election, showing how many followed each party's candidates exclusively (solid colour) and how many also followed the candidates of one or more additional parties (transparent)
Total public Twitter followers of all candidates in the 2017 General Election, showing how many followed each party’s candidates exclusively (solid colour) and how many also followed the candidates of one or more additional parties (transparent)

Continue reading “Who won the Twitter election? Part ii: ‘faithful’ and ‘promiscuous’ followers”

Who won the Twitter election? Part i: followers, and which party’s candidates tended to have more of them

Just over half a year ago, the Telegraph carried out an analysis appearing to show that ‘the Labour leader’s shadow cabinet d[id]n’t have as wide a reach as their opposite numbers on Twitter’. This conclusion was arrived at by comparing ministers and shadow ministers whose roles were directly parallel: ‘[Jeremy] Corbyn has more followers than Theresa May, while Diane Abbott saw off Amber Rudd, John McDonnell beat Philip Hammond and Keir Starmer edged out David Davis’, but with regard to the others, ‘the Government enjoyed a clean sweep of the board’ (ibid.).

This is interesting, but I don’t find it satisfactory. The Conservative Party’s best known and most popular politicians were mostly in the cabinet. But while Corbyn himself remains the Labour Party’s biggest social media star, its second- and fourth-most popular MPs on Twitter were and are excluded from the shadow cabinet by virtue of not being Corbyn loyalists, while the third-most popular has technically remained a shadow cabinet member but was excluded from the Telegraph’s analysis by virtue of having no Tory opposite number.

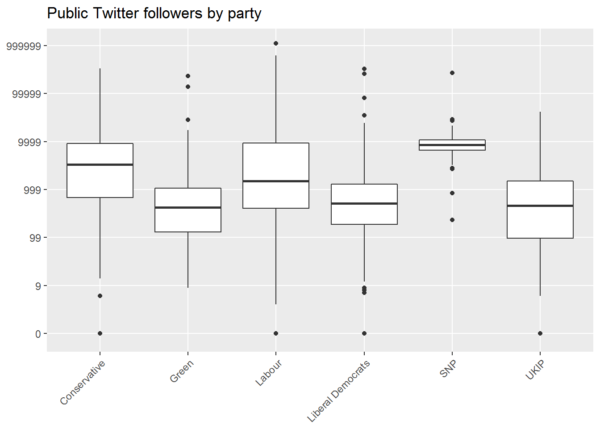
So what happens if we look at the public followers of all prospective parliamentary candidates? This happens. (Figures collected in the week before the General Election for a different purpose and re-used here. Small parties excluded. If you want code, here’s my notebook. Hat tip to Democracy Club for its crowdsourced list of politicians’ social media accounts.)

Twitter following by party, GE 2017

Continue reading “Who won the Twitter election? Part i: followers, and which party’s candidates tended to have more of them”

Did Jewish Labour voters turn towards the Conservative Party or the Liberal Democrats in 2017?

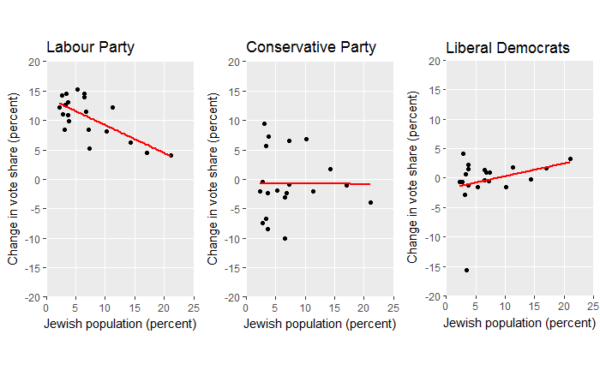
Last week, I published a blog post showing that North London constituencies bucked the national trend by swinging less heavily towards Labour than might otherwise have been expected. I have since repeated the analysis, looking at changes in votes for the Labour Party, Conservative Party, and Liberal Democrats in the twenty British constituencies with the highest Jewish populations. The findings of that analysis are consistent with the view that many British Jews who had previously voted Labour turned away from the party in response to its continued mishandling of its ongoing antisemitism crisis, but — contrary to some indications that ‘the Tories were likely to take huge swathes of Jewish votes’ — they did not turn towards the Conservative Party. Instead, such voters seem more likely to have voted Liberal Democrat.

2015-2017 changes in vote share for the Labour Party, Conservative Party, and Liberal Democrats in the 20 British constituencies with the highest Jewish populations

Continue reading “Did Jewish Labour voters turn towards the Conservative Party or the Liberal Democrats in 2017?”

The electoral cost of left wing antisemitism

EDIT (2 Jul 2017): See also my subsequent analysis of the Labour, Conservative, and Liberal Democrat vote in the 20 British constituencies with the highest Jewish populations

EDIT (12 April 2019): I also analysed 2018 local election results in Barnet: the local authority with the highest Jewish population in the UK. This analysis was reported on the front page of the Jewish Chronicle on 10 May 2018.  

The UK’s 2017 general election campaign was marred by overt racism against Jews on the part of some supporters of Jeremy Corbyn, perhaps most dramatically expressed in the erection of a vast antisemitic banner in a central location in the city of Bristol. Moreover, it came hard on the heels of the Labour Party’s failure to discipline Corbyn’s long-term ally, Ken Livingstone over his appalling historical distortions with regard to Adolf Hitler and the Zionist movement.

The Labour leadership is riding high at the moment, thanks to its less-severe-than-expected defeat in the face of an utterly shambolic Tory campaign. However, there’s been some discussion as to the electoral cost of its failures with regard to the Jewish community (see e.g. Marcus Dysch in the Jewish Chronicle).

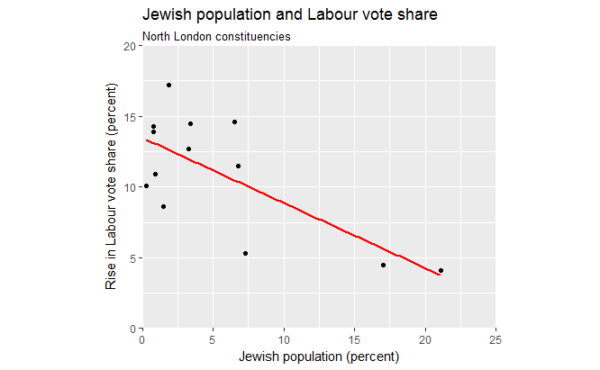
Can we put a figure on that cost? If we look at voting in the part of the country with the highest Jewish population, we find that two percent more Jews in a constituency implies a roughly one percent smaller rise in Labour’s vote share.

Change in Labour vote share in North London constituencies, and their Jewish population

Continue reading “The electoral cost of left wing antisemitism”

Keeping Corbyn in the Labour Leader’s office, and Labour out of government: ‘socialism fans’ and the culture of Corbynism

Jeremy Corbyn was elected leader of the Labour Party in September 2015, and (following a vote of no confidence and a leadership challenge) re-elected to the same post in September 2016. In February this year, many of those who had re-elected him expressed disappointment at his effectively unconditional support for Conservative Prime Minister Theresa May’s invocation of the Article 50 process to leave the European Union; perhaps to placate them, Corbyn subsequently called for a demonstration in support of those who would suffer the most from EU withdrawal, but then failed to turn up. Part of the public rationale for Corbyn’s three-line whip on the Brexit vote was that if the party opposed it, then that might lead to a loss of support in predominantly working class constituencies in the North and the Midlands that had voted Leave by large margins: constituencies such as Copeland and Stoke-on-Trent Central, where the party nevertheless went on to lose vote share in by-elections later the same month. But despite all this — despite Brexit, which Labour Party members and voters had overwhelmingly voted against, and despite what was arguably the worst by-election performance for an opposition party since the late 19th century (see O’Hara 2017) — Corbyn’s supporters in the Labour Party are still for the most part Corbyn’s supporters in the Labour Party, and they’re not going anywhere — and neither, therefore, is the man himself. Asked whether Corbyn’s continued leadership of the party was a good thing, the answer from sidelined Deputy Leader of the Labour Party, Tom Watson, was pragmatic: ‘It doesn’t matter; that is the situation’ (interviewed in Walker 2017). This impasse will not endure forever: Prime Minister Theresa May has called for an early General Election, and Corbyn (who has been asking for one since December last year) has given his support. But in the six weeks that we have left until the Labour Party is overwhelmingly (and perhaps irreparably) crushed, it may perhaps be worth reflecting on how it got into this appalling mess.

Continue reading “Keeping Corbyn in the Labour Leader’s office, and Labour out of government: ‘socialism fans’ and the culture of Corbynism”

Approval ratings among Londoners for the U.K. party leaders, plus the Mayor and the Ex-Mayor

Findings from a recent opinion poll were repeatedly shared on Labour Party-affiliated social media groups over the last weekend. The poll was commissioned by researchers at Queen Mary University of London’s Mile End Institute, and asked people in London both about their voting intentions and about how well they felt that seven particular politicians were doing in their current jobs. Social media users commonly focused on the politicians’ net job approval ratings: that is, the percentage of people saying that each politician was doing well in his/her job minus the percentage of people saying that each politician was doing badly in his/her job. The seven politicians in question were the leaders of the Labour Party, the Conservative Party, the Green Party, the Liberal Democrats, and Ukip (i.e. Jeremy Corbyn, Theresa May, Caroline Lucas, Tim Farron, and Paul Nuttall, respectively), plus the Mayor and the ex-Mayor of London (i.e. Sadiq Khan and Boris Johnson, again respectively). If you are not fortunate enough to spend a little part of each week staring at the slow motion car crash that is political social media, you may also have come across the same poll in newspaper reports that similarly focused on the finding that ‘Jeremy Corbyn has a worse personal approval rating even in London than every other major party leader, including Ukip’s Paul Nuttall’ (Peck, 2017).

Continue reading “Approval ratings among Londoners for the U.K. party leaders, plus the Mayor and the Ex-Mayor”

Parliamentary elections in Whitehaven/Copeland and Stoke-on-Trent Cental

Labour’s performance in recent by-elections has been — shall we say — a little weak. As Glen O’Hara (2017) observes, ‘[g]overnments have increased their by-election vote share only seven times since 1970’, but two of those occasions were last month, which was ‘the first time the Government has seen its vote rise in two simultaneous by-elections since 1954’. Who is to blame? Some point the finger at Neil Kinnock and Tony Blair for selling out the interests of the working classes — as supposedly represented by the party’s ‘hard left’ wing, until recently led by the late Tony Benn — and chasing the middle class vote instead. But this version of events rests on a misunderstanding of the Labour vote: Theo Bertram’s (2017) analysis shows that the Labour Party has only won General Elections when the proportion of skilled workers voting Labour rose and the proportion of skilled workers voting Conservative fell (yes, this happened under Blair; the opposite happened under Corbyn).

Bertram’s much smarter than me, but his argument is based on opinion polls, which not everybody appears to respect. For that reason, I thought I’d create some charts showing shares of the actual vote in strongly working class constituencies. Hmm, how about Copeland (formerly, Whitehaven) and Stoke-on-Trent Central?

Continue reading “Parliamentary elections in Whitehaven/Copeland and Stoke-on-Trent Cental”