On Friday, I posted some analysis of groups of English voters defined by the combinations of choices they made in a succession of votes. That was the first installment of a multi-part response to Stephen Bush’s recent article on why we should stop focusing so obsessively on people who voted Labour in 2015 and then voted to leave the European Union in 2016. I’d now like to take a look at those who didn’t vote at all in the 2015 general election.
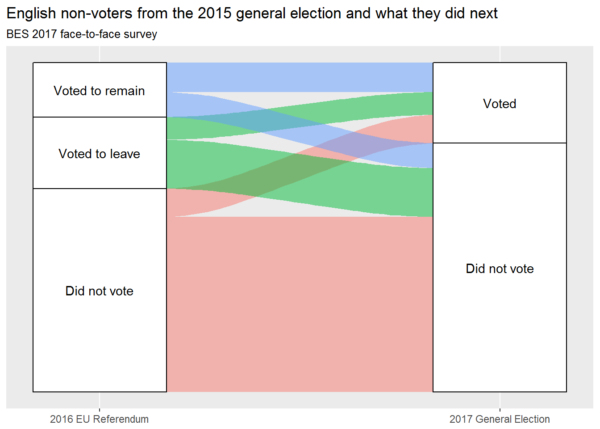
Excluding those who did not vote because they were ineligible, there were 290 GE2015 non-voters in the dataset that I’m using: an English subset of the post-election 2017 face-to-face survey carried out as part of the long-running and hugely respected British Election Study. The 290 become 311 or more if we weight for demographic group, as I did for Friday’s analysis – which indicates that the non-voters were from demographic groups that were under-represented in the sample as a whole. (It’s only slightly less difficult to get non-voters to answer a survey than it is to get them into a polling booth, as we see from the fact that just 15% of the sample did not vote in an election with 66% turnout.) But because 290 is a small sample and weighting tends to magnify the effect of sampling error, I’ve used unweighted counts throughout this post (not that weighting made an appreciable difference to any of the patterns I will talk about below). The following alluvial diagram (created using the R package, ggalluvial) tracks the voting behaviour of sampled 2015 non-voters post-2015:
That diagram is a pretty clear illustration of the truism that non-voters don’t vote. Most members of the sample who didn’t vote in the 2015 general election also did not vote in the 2017 general election. And while slightly more of them voted in the 2016 EU membership referendum, most of them didn’t vote in that either. This is despite the fact that some of those who didn’t vote in 2015 will likely have been habitual voters who – for one reason or another – did not happen to vote in that particular election, yet subsequently returned to past form.
Here’s an interesting point, though. The majority of those GE2015 non-voters in the sample who did vote in the 2016 referendum voted Leave, and the majority of those who voted Leave did not vote in GE2017. But the Remain-voting minority bucked the overall trend. Of the mere 48 GE2015 non-voters in the sample who voted Remain in the 2016 referendum, 26 went on to vote in the next general election, while of the 179 who did not vote in the referendum, just 25 went on to do the same.
What are we to make of this?
A few thoughts:
- The sample of GE2015 non-voters appears to consist, to a fairly great extent, of people who are generally disinclined to vote (though not all non-voters in any particular election or referendum will belong to that group, and the same is probably true of this specific sample of non-voters from that specific election)
- On the evidence of their subsequent voting history, these people seem to have been slightly less disinclined to vote in the 2016 EU membership referendum than in the 2017 general election. Perhaps that’s because referenda generally seem more meaningful to them than elections do, or perhaps it’s because of something specific about that particular referendum
- It seems possible that voting Remain in the 2016 EU membership referendum somehow led previously habitual non-voters into higher levels of political involvement from that point onward
- However, it may simply be that those habitual voters who just happened not to vote in 2015 (and therefore became part of the analysis presented here despite not being habitual non-voters) were over-represented within the minority of GE2015 non-voters who voted Remain the following year (whether in the wider population or only in this sample of it). If this is the case, then we may not be looking at a ‘Remain effect’ among previously habitual non-voters, but at a tendency towards Europhilia on the part of some habitual voters who temporarily got mixed up with them
- Because we don’t know how any of these people voted in 2010, their voting histories as recorded in these data would seem to offer little prospect of helping us to decide between the interpretations in points 3 and 4, even if we could be confident that the different proportions were not the result of sampling error (which we can’t, because the absolute numbers are so small)
Now for the statistic that many of you will have been waiting for. Of the 24% of GE2015 non-voters in the sample who did vote in the 2017 general election, a remarkable 61% voted Labour. But here’s the rub: that’s 61% of 24% of 15%, which means that we’re only talking about 41 actual people out of a sample of 1874. And this has to be seen in context of an overall picture that reveals losses to non-voting as well as gains from it. In 2017, Labour picked up 41 members of the sample who hadn’t voted in 2015, but 55 of its GE2015 voters from the same sample went the other way and didn’t vote. The difference between those two figures is less than 1% of the sample. In the bigger scheme of things, it just doesn’t matter.
From the point of view of political sociology, it’s vitally important to understand non-voters. And if I were going to pick any single ‘voter’ group for my research moving forward, I think that I could do much worse than to focus on the voluntarily self-disenfranchising.
But habitual non-voters are not going to have a decisive impact on the next general election.
Too few of them vote.
