Like many, I read with interest Stephen Bush’s recent article on ‘The nine voter groups who are more important than Labour Leavers’. If Bush were a grant awarding institution, there would be money available for researching those groups. Well, he isn’t, so there isn’t, but I like a challenge so I’m going to make a start anyway – using open data from the British Election Study (henceforth, BES). To be more specific, I’ll be using the BES 2017 face-to-face survey, which was conducted after the election and uses what should probably be considered a more genuinely random sample than the online waves.
If we focus only on England (because the other parts of the UK have really quite different political systems), this gives us 1874 respondents, or 1839 after weighting for demographic group. Even after weighting, Labour voters are over-represented, but we’re not trying to predict last year’s election – we’re trying to understand why people made the voting choices that they did, and to use that information to derive hints about what voting choices they might make in future.
Bush’s general approach was to identify groups by how they have voted in recent years. Groups identified in this way are more or less important, if I understand him correctly, according to how much they might sway the result of future elections. And a group’s ability to do that would presumably depend upon (a) its size and (b) its likelihood of flipping from one party to another, given some sort of predictable event such as a political party coming out for some particular policy.
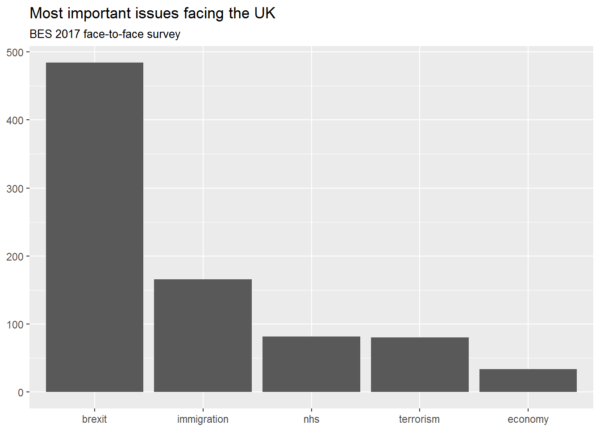
What sort of a policy might that be? Respondents to the survey gave a pretty clear hint of that in their responses to the open question, ‘As far as you’re concerned, what is the single most important issue facing the country at the present time?’ Although Jeremy Corbyn and Theresa May largely succeeded in avoiding discussing Brexit policy during the 2017 election campaign, Brexit was clearly the most popular answer. And well it might have been, I might add, because all the other issues in the top five clearly depend on what kind of a Brexit the UK actually gets. (Note for the nerds: what I’m actually counting here is the number of respondents who gave each of these words as a one-word answer, plus the number of respondents who began their answers with one of these words, or a morphologically related word, e.g. ‘immigrants’ was counted under ‘immigration’. Also, throughout this article I’m using the BES team’s wt_demog weighting.)
The overwhelming importance given to Brexit is analytically convenient, because one of the last three important UK-wide votes was the 2016 referendum on continued membership of the EU, so if we use that referendum to define our groups (as Bush did in some cases), then the definition of the groups themselves will give us an indication of how they might feel about the policy area that their members seem to regard as most important.
So now to those groups.
There are some that I’d like to come to at a later date (in particular, ‘Conservative voters in 2017’ and ‘Labour 2017, Gives An Answer Other Than “Jeremy Corbyn” When Asked Who Would Make The Best Prime Minister’). But right now I’m intrigued by the possibility Bush raises of dividing up the electorate by combinations of 2015 General Election, 2016 EU referendum, and 2017 General Election votes
Bush lists four of these: ‘Conservative 2015, Remain 2016, Labour 2017’, ‘Conservative 2015, Remain 2016, Conservatives 2017’, ‘Non-voting until 2016, Remain 2016, Labour 2017’, and ‘Non-voting until 2016, Leave 2016, Non-voting 2017’ (the latter of which he lumped together with an implied fifth group, ‘UKIP 2015, Leave 2016, Non-voting 2017’). But even if we limit ourselves to the four main parties (Conservative, Labour, Liberal Democrat, and UKIP) plus ‘other’ as a catch-all plus non-voting in the two general elections, plus the three possible responses to the 2016 referendum (Leave, Remain, and non-voting), there are an awful lot of potential groups: 108 of them, to be precise. Or 126 if we distinguish those who didn’t vote in 2015 from those who couldn’t vote, e.g. because they were too young. (I made this distinction in my analysis but it didn’t seem to make any difference to the overall picture.) Most of these groups are going to be too small as to be important. If voters are evenly distributed between all 108 or 126 groups, then less than 1% will fall into each, and if they are not, then less than 1% will fall into each of most of them.
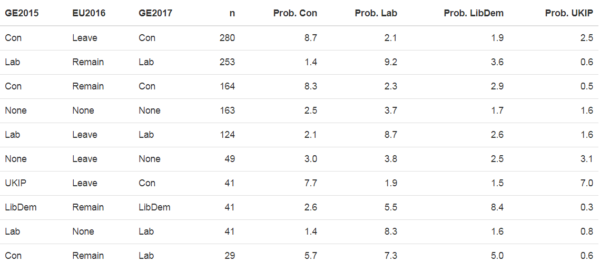
With R’s dplyr package, it’s quite easy to divide up survey respondents according to combinations of votes (using group_by), and then calculate each group’s average responses to the question ‘How likely is it that you would ever vote for each of the following parties?’ (on a scale from 0 to 10) to give a sense of their probability of flipping in the next election (using summarise). Here are the ten largest:
As the table shows, the largest groups are of people whose voting behaviour was the same in 2017 and 2015, regardless of what they did or didn’t do in 2016. That’s not particularly surprising, because the British electorate isn’t known for shopping around: by and large, Conservative voters vote Conservative, Labour voters vote Labour, and non-voters don’t vote.
But the table contains a very clear hint that Bush might be right in his main thesis that ‘Labour Leavers – that is, voters who backed Labour in 2015 and Leave in the referendum of 2016 – have received an outsized share of attention and analysis’. As we see from the above, the ‘Labour 2015, Remain 2016, Labour 2017’ group is much, much bigger than the ‘Labour 2015, Leave 2016, Labour 2017’ group, and – given the probability scores – the former looks much more amenable to being poached by the (anti-Brexit) Liberal Democrats than the latter does by the (pro-Brexit) UKIP and Conservative Party. Meanwhile, there was no other combination beginning ‘Labour 2015, Leave 2016’ that was large enough to make the top 10, indicating that there has been no major exodus of Leave voters from Labour to elsewhere.
When we remember the recent survey finding that ‘fewer than one third (32%) [of Labour Leavers] think [that leaving the EU is] very important’ while ‘over half (51%) [of Labour Remainers] say [that staying in the EU] is very important’, there is therefore clearly now a substantial body of evidence to indicate the greater potential for Labour Remainers than Labour Leavers to influence the result of a future general election – provided that somebody makes a bid for their support. Whoever it is, it probably won’t be the Labour leader, a lifelong Eurosceptic who called for the invocation of Article 50 before even Nigel Farage. But as I said last June, Paris might be worth a mass.
Looking further down the list, ‘Conservative 2015, Remain 2016, Labour 2017’ looks very much like a floating vote, giving very similar probability scores for all parties except UKIP, which it would seem to regard as beyond the pale. In fact, the only top 10 group giving UKIP a score higher than 3.1 was ‘UKIP 2015, Leave 2016, Conservative 2017’: the Leave-voting UKIP-Conservative switchers who decimated Paul Nuttall’s already shaky credibility last June. Those switchers might switch again. But, based on the probability scores, they don’t seem to like Labour or the Liberal Democrats very much, and right now the chances of UKIP’s winning back anybody’s vote with its current leadership and financial difficulties are looking pretty remote. And even the 3.1 came from ‘None 2015, Leave 2016, None 2017’: a small group that is, like the much larger ‘None 2015, None 2016, None 2017’, unlikely to vote for anyone in the near future (not only on the evidence of its avowedly low likelihood of voting for any of the four main parties but on the evidence of, ahem, past behaviour). Those two groups can, I think, fairly safely be written off as unimportant, at least in the sense defined above. (I know that sounds elitist, but if people don’t want to vote for anything that’s available, then they can’t influence elections.) The Conservatives might be able to attract the ‘UKIP 2015, Leave 2016, UKIP 2017’ group next time around, but it was too small to make the top ten above and therefore its departure from the UKIP fold probably won’t have much of an impact on anything now that the bulk of 2015 UKIP voters has already left for pastures new.
So it looks as if UKIP voters have had their (admittedly gigantic) effect and are now a spent force, and – all in all – the groups to watch from now on are the very large group of Labour Remainers – only a small proportion of which would need to peel off and vote for another party to make an impact at the polls – and the much smaller group of Remain-voting Conservative-Labour switchers, whose votes have migrated once and (even if we did not have the evidence of the probability scores above) might therefore be assumed to be more than averagely predisposed to migrate again. Labour Leavers are much smaller in number than one of the aforementioned, and – it seems – more likely than both to stay put.
Now to the inevitable caveat. While the approximate relative sizes of these groups are probably a robust finding (because the poll itself was so large), the average probability scores for a group become less and less reliable as the size of the group falls: for example, the averages in the final row in the table above are the findings of what was in effect a poll of 29 people, so the margin of error will be huge, and I mention the scores above only because they are more-or-less what we might expect given that particular group’s voting history.
We could find greater numbers of people falling within each group from the BES online panel, but that has representativeness problems of its own, and what we’re coming to here is an essential problem of the approach of splitting survey respondents up into discrete groups of successively smaller size. I’ve done some more analysis that takes a slightly different approach in order to mitigate that problem, but I’ll save it for a future post.

