[Cross-posted from http://valuingelectronicmusic.org/2014/09/08/geography-soundcloud-following/]
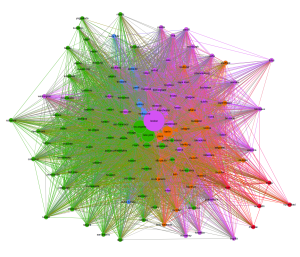
Wanting to find out what was typical SoundCloud behaviour – as opposed to what our case study users were doing – we took a random sample of 150000 SoundCloud accounts earlier this year and downloaded their profile data, plus the profile data of everyone they were following (plus some other stuff, but that’s for another time). One of the things we did with this data was to construct a social network graph showing ‘follow’ relationships at city level: every time our computer program found that a sampled user self-identified with city A followed a user self-identified with city B, it created an ‘arc’ (represented with an arrow) from city A to city B. We then combined all the arcs so that instead of, say, 2000 arcs from city A to city B, there would now be a single arc with a ‘weight’ of 2000. We then imported this data into Gephi, sized the nodes representing cities to reflect the total weight of all the incoming arcs, positioned them with the Force Atlas algorithm, and used the Louvain community detection method to identify ‘clusters’, where a cluster is a group of nodes that are better connected to each other than they are to nodes from outside the group. And here’s the result, with five colours to represent the five clusters.
There’s a lot to be said about this graph (including about its relationship to genre), but I’ll restrain myself to two observations today.
The first is that the clusters detected are substantially determined by geography: the largest cluster, in green, consists mostly of US cities; the two next-largest clusters, in pink and orange, consist mostly of European cities (with London the largest node in one and Paris and Berlin the largest nodes in the other); Australian cities and (relatively) nearby Kuala Lumpur form a small community in blue; and there is a cluster of West and South Asian cities at the bottom right, in red. Geographically proximal pairs of cities often appear close together within the same clusters (e.g. Vienna and Budapest, or Birmingham and Liverpool), and, while it has not been identified as a cluster at this level of resolution, there is also a clear group of Philippine and Indonesian cities at the top left. Given that SoundCloud is a purely digital, purely online music distribution system that appears to do nothing to encourage users to follow those who are near to them (e.g. it does not provide a recommendation list of ‘DJs near you’ or similar), this is an interesting finding which may point to the continued importance of local, regional, national, and world-regional music scenes even in the age of the internet. Furnished with a free choice of which musicians to ‘follow’ on SoundCloud, it seems that people tend to follow those close to home.
Well, and those in London and New York. The second point I wanted to note is that the largest and most central nodes all represent cities in the developed world, mostly in Western Europe and North America. These are the very cities that dominate conventional media production and distribution on a global level, especially with regard to revenues: India and Nigeria may make more movies than the US, for example, but American movies cost and make far more money. That this pattern of domination should recur in a free-to-consumer ‘new media’ distribution system suggests that Web 2.0 technologies may do less than one might assume to disrupt existing cultural inequalities and exclusions. For example, the group of Philippine and Indonesian cities at the top left and the cluster of West and South Asian cities at the bottom right can easily be identified as peripheral on the visual level, and they turn out to have very low eigenvector centrality (this being a measure that reflects not only the number of incoming arcs that a node receives, but also the centrality of the nodes at which those arcs originated): far lower than that of apparently peripheral American cities. And something you can’t see from this graph is that developing world cities that appear fairly centrally placed in the graph often have substantially lower eigenvector centrality than their surrounding nodes: see in particular Cairo, Karachi, and Ciudad de México. The Force Atlas positioning algorithm placed these close to the centre of the graph because of who their inhabitants follow – and not because of who follows them.
But this is a familiar lesson from internet research: just because the world can (potentially) hear your voice doesn’t mean that anyone will listen.
[Comments closed here. If you would like to comment on this piece, please do so at http://valuingelectronicmusic.org/2014/09/08/geography-soundcloud-following/]
